This training will demonstrate how to reproduce analyses performed in the Galaxy framework. Before we start with the hands-on part, we would like to give you some information about Galaxy.
Galaxy is a scientific workflow, data integration and data analysis and publishing platform. Galaxy is an open-source platform for accessible, reproducible, and transparent computational research. While Galaxy was started to allow non-bioinformaticians to analyze DNA sequencing data, it nowadays enables analysis tasks of many different domains including machine learning, ecology, climate science and omics-type of analyses. Galaxy is easy to use because it is accessible via a web-browser and provides a graphical user interface which enables access to pre-installed tools and large computational resources. In Galaxy, all analyses are stored in so-called histories. The history keeps track of all the tools, tool versions and parameters that were used in the analysis. From such a history, a workflow can be extracted; this workflow can be used to easily repeat the analysis on different data. Both, histories and workflows, can either be shared privately with colleagues or publicly, for example as part of a published manuscript.
For more background information about Galaxy, have a look into the Galaxy publication (Afgan et al. 2018). In depth technical details about technologies that enable reproducible analyses within Galaxy are described in Grüning et al. 2018.
Many different Galaxy servers exist. Some are public, some are private, some focus on a specific topic and others like the usegalaxy.* servers cover a broad range of tools. To reproduce published results it is highly recommended to use the same Galaxy server that was used in the original study. In the case that this was a private server that is not accessible to you, you might want to use one of the main Galaxy servers: UseGalaxy.eu, UseGalaxy.org, UseGalaxy.org.au, UseGalaxy.fr, UseGalaxy.ca. To learn more about the different Galaxy servers visit the slides: options for using Galaxy. The particular Galaxy server that you are using may look slightly different than the one shown in this training. Galaxy instance administrators can choose the exact version of Galaxy they would like to offer and can customize its look to some extent. The basic functionality will be rather similar across instances, so don’t worry! In this training we will use the European Galaxy server on which the original analysis was performed and shared.
Hands On: Log in or register
Open your favorite browser (Chrome/Chromium, Safari or Firefox, but not Internet Explorer/Edge!)
Choose Login or Register from the navigation bar at the top of the page
If you have previously registered an account with this particular instance of Galaxy (user accounts are not shared between public servers!), proceed by logging in with your registered public name, or email address, and your password.
If you need to create a new account, click on Register here instead.
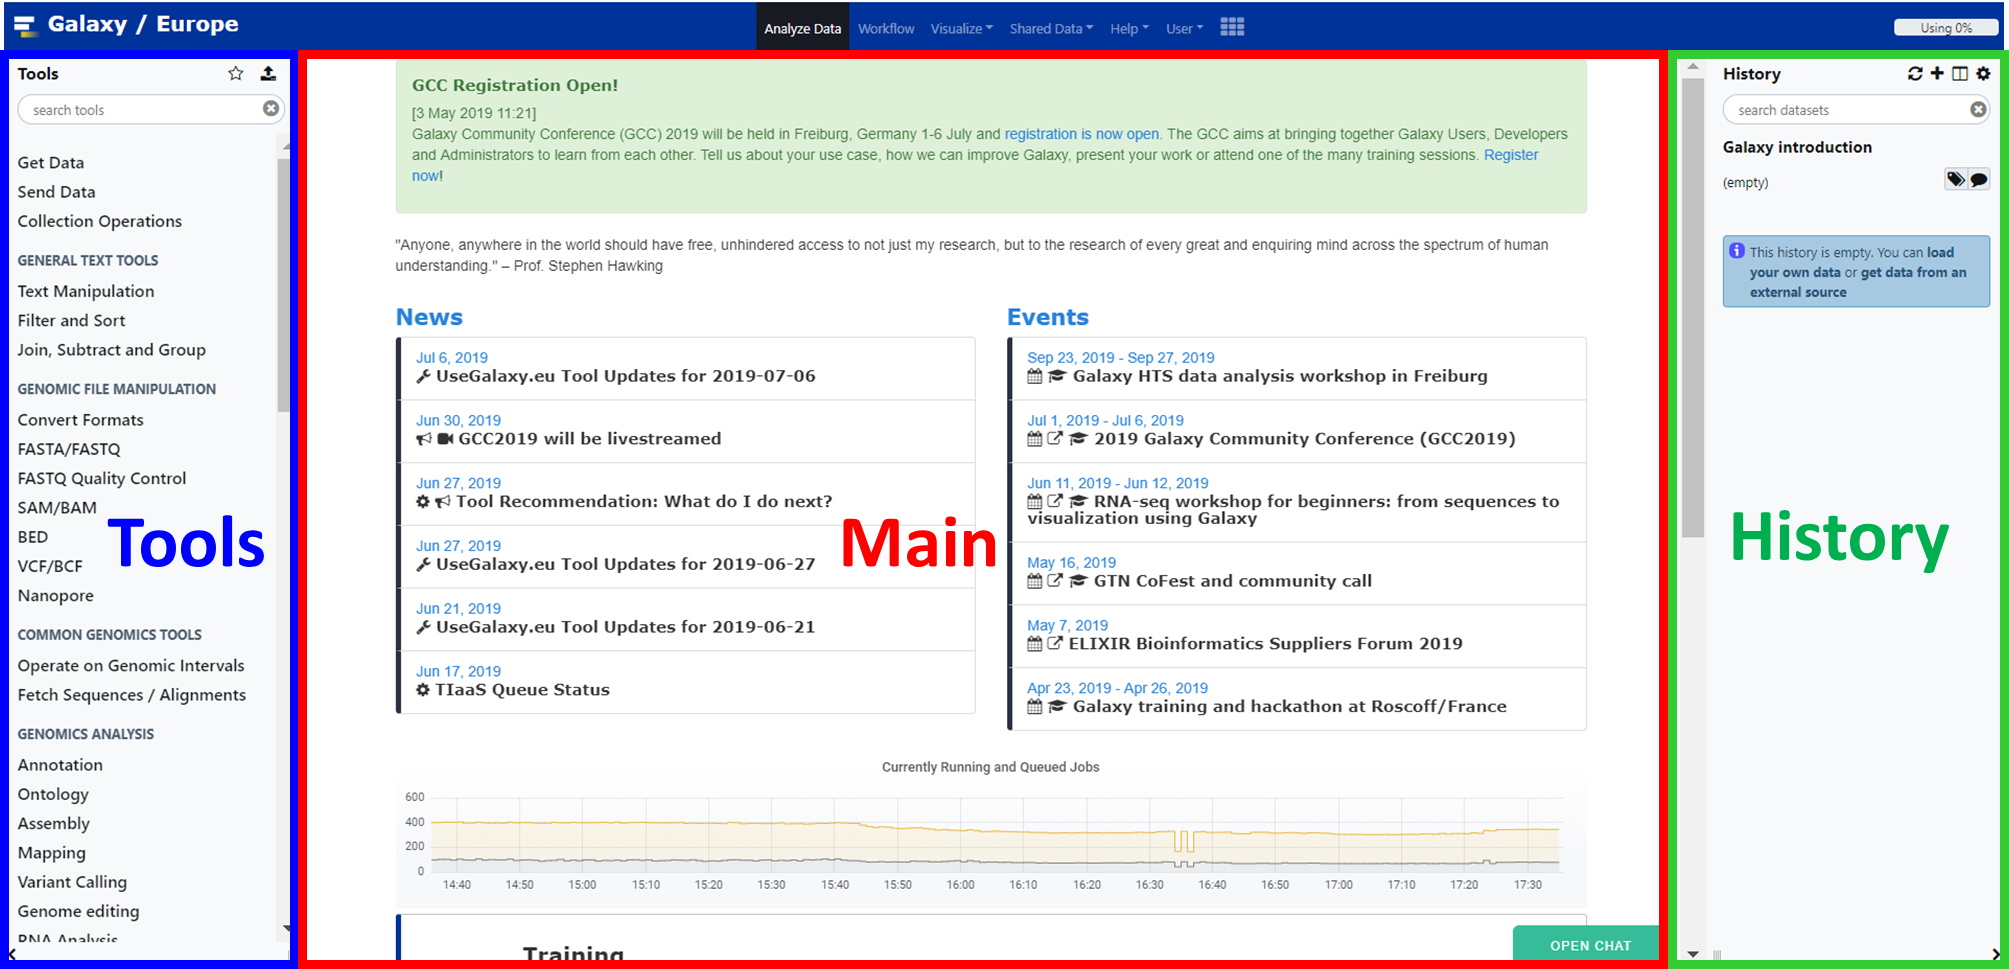
The Galaxy interface consists of three main parts:
The available tools are listed on the left
Your analysis history is recorded on the right
The central panel will let you run analyses and view outputs
Create a history and load data into it
Each analysis in Galaxy starts by creating a new analysis history and loading data into it. Galaxy supports a huge variety of data types and data sources. Different ways of bringing data into Galaxy are explained in the interface slides. To reproduce published results, the data needs to be loaded from the public repository where the authors have deposited the data. This is most often done by importing data via a web link.
Hands On: Create history
Make sure you start from an empty analysis history.
To create a new history simply click the new-history icon at the top of the history panel:
Rename your history to be meaningful and easy to find. For instance, you can choose Reproduction of published Galaxy results as the name of your new history.
Click on galaxy-pencil (Edit) next to the history name (which by default is “Unnamed history”)
Type the new name: Reproduction of published Galaxy results
Click on Save
To cancel renaming, click the galaxy-undo “Cancel” button
If you do not have the galaxy-pencil (Edit) next to the history name (which can be the case if you are using an older version of Galaxy) do the following:
Click on Unnamed history (or the current name of the history) (Click to rename history) at the top of your history panel
Type the new name: Reproduction of published Galaxy results
Press Enter
Comment: Background about the dataset
The Iris flower data set, also known as Fisher’s or Anderson’s Iris data set, is a multivariate dataset introduced by the British statistician and biologist Ronald Fisher in his 1936 paper (Fisher 1936).
Each row of the table represents an iris flower sample, describing its species and the dimensions in centimeters of its botanical parts, the sepals and petals.
You can find more detailed information about this dataset on its dedicated Wikipedia page.
Hands On: Data upload
Import the file iris.csv from Zenodo or from the data library (ask your instructor)
https://zenodo.org/record/1319069/files/iris.csv
Copy the link location
Click galaxy-uploadUpload at the top of the activity panel
Select galaxy-wf-editPaste/Fetch Data
Paste the link(s) into the text field
Press Start
Close the window
Renamegalaxy-pencil the dataset to iris
Click on the galaxy-pencilpencil icon for the dataset to edit its attributes
In the central panel, change the Name field
Click the Save button
Check the datatype
Click on the history item to expand it to get more information.
The datatype of the iris dataset should be csv.
Changegalaxy-pencil the datatype if it is different than csv.
Option 1: Datatypes can be autodetected
Option 2: Datatypes can be manually set
Click on the galaxy-pencilpencil icon for the dataset to edit its attributes
In the central panel, click on the galaxy-chart-select-dataDatatypes tab on the top
Click the Auto-detect button to have Galaxy try to autodetect it.
Click on the galaxy-pencilpencil icon for the dataset to edit its attributes
In the central panel, click galaxy-chart-select-dataDatatypes tab on the top
In the galaxy-chart-select-dataAssign Datatype, select csv from “New Type” dropdown
Tip: you can start typing the datatype into the field to filter the dropdown menu
Click the Save button
Add an #iris tag galaxy-tags to the dataset
Datasets can be tagged. This simplifies the tracking of datasets across the Galaxy interface. Tags can contain any combination of letters or numbers but cannot contain spaces.
To tag a dataset:
Click on the dataset to expand it
Click on Add Tagsgalaxy-tags
Add tag text. Tags starting with # will be automatically propagated to the outputs of tools using this dataset (see below).
Press Enter
Check that the tag appears below the dataset name
Tags beginning with # are special!
They are called Name tags. The unique feature of these tags is that they propagate: if a dataset is labelled with a name tag, all derivatives (children) of this dataset will automatically inherit this tag (see below). The figure below explains why this is so useful. Consider the following analysis (numbers in parenthesis correspond to dataset numbers in the figure below):
a set of forward and reverse reads (datasets 1 and 2) is mapped against a reference using Bowtie2 generating dataset 3;
dataset 3 is used to calculate read coverage using BedTools Genome Coverageseparately for + and - strands. This generates two datasets (4 and 5 for plus and minus, respectively);
datasets 4 and 5 are used as inputs to Macs2 broadCall datasets generating datasets 6 and 8;
datasets 6 and 8 are intersected with coordinates of genes (dataset 9) using BedTools Intersect generating datasets 10 and 11.
Now consider that this analysis is done without name tags. This is shown on the left side of the figure. It is hard to trace which datasets contain “plus” data versus “minus” data. For example, does dataset 10 contain “plus” data or “minus” data? Probably “minus” but are you sure? In the case of a small history like the one shown here, it is possible to trace this manually but as the size of a history grows it will become very challenging.
The right side of the figure shows exactly the same analysis, but using name tags. When the analysis was conducted datasets 4 and 5 were tagged with #plus and #minus, respectively. When they were used as inputs to Macs2 resulting datasets 6 and 8 automatically inherited them and so on… As a result it is straightforward to trace both branches (plus and minus) of this analysis.
Make sure the tag starts with a hash symbol (#), which will make the tag stick not only to this dataset, but also to any results derived from it.
This will help you make sense of your history.
Some input datasets might need more specialized treatment than explained here.
A few data types contain more than one subfile. These are uploaded via the composite data function, which is a new tab on the right of regular upload. Then at the bottom set “composite type” to your file format. For each subfile a select box will appear with a description next to it, about which subfile has to be selected where.
Some workflows require input files as dataset collections, in such cases “Input dataset collection” are shown as input when editing or viewing the workflow in the workflow menu. Collections contain several single dataset of the same type tied together. In case a workflow input requires a collection, you’ll need to build a collection out of your files after uploading them.
A specialized training explains how to use collections.
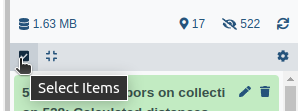
Click on galaxy-selectorSelect Items at the top of the history panel
Check all the datasets in your history you would like to include
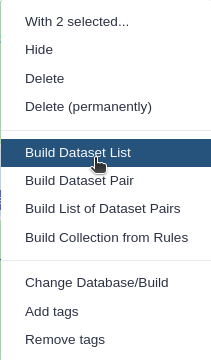
Click n of N selected and choose Advanced Build List
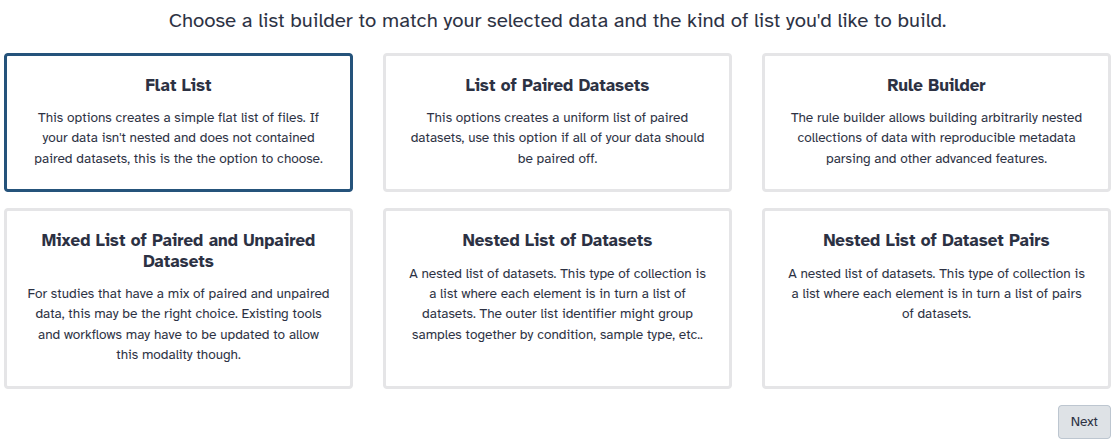
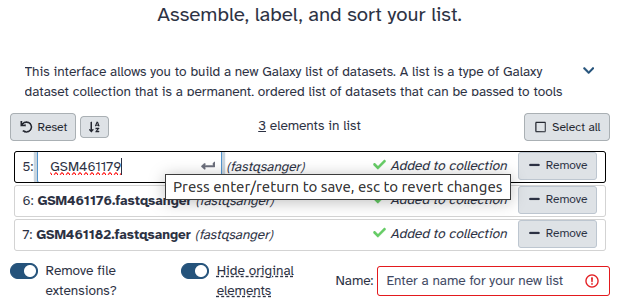
You are in collection building wizard. Choose Flat List and click ‘Next’ button at the right bottom corner.
Double clcik on the file names to edit. For example, remove file extensions or common prefix/suffixes to cleanup the names.
Enter a name for your collection
Click Build to build your collection
Click on the checkmark icon at the top of your history again
In case you want to run a published Galaxy workflow on your own data, you can find explanations about the options to upload your own data in the interface slides.
Import and run a Galaxy workflow
Galaxy workflows may be published either directly via the Galaxy server or on public workflow repositories such as WorkflowHub. Thus the workflow may be present in one of the three ways:
As a .ga file or url link, which needs to be imported into Galaxy
As a link from a personal Galaxy server account that needs to be added to the own Galaxy account
as a link that directly starts running the workflow in a specific Galaxy server, which is possible via the WorkflowHub website.
This tutorial follows option 1, but options 2 and 3 are no more difficult
This is not part of the training, but information in case you received a workflow of interest via way 2) or 3).
Link from a personal Galaxy:
In case you received a link from a personal Galaxy user account
you need to log into exactly the same Galaxy server from where the workflow link is shared, which should be clear from the start of the link, e.g. “https://usegalaxy.eu/…”
Click on the link and on the upper right on to the plus symbol (import workflow)
Continue with Step 2 of the following hands-on box
Link from WorkflowHub:
In WorkflowHub there is an option to directly run a workflow.
Make sure that you prepared your input data on the same server as specified in the run button.
Click on “Run on usegalaxy.eu”
select inputs
“Run workflow”
Hands On: Import and run workflow available as .ga file or link
Import the workflow either via url directly from Zenodo or by uploading the .ga file
Click on galaxy-workflows-activityWorkflows in the Galaxy activity bar (on the left side of the screen, or in the top menu bar of older Galaxy instances). You will see a list of all your workflows
Click on galaxy-uploadImport at the top-right of the screen
Provide your workflow
Option 1: Paste the URL of the workflow into the box labelled “Archived Workflow URL”
Option 2: Upload the workflow file in the box labelled “Archived Workflow File”
Click the Import workflow button
Below is a short video demonstrating how to import a workflow from GitHub using this procedure:
Video: Importing a workflow from URL
Start the workflow by clicking on the run symbol on the last column in the workflow overview list
Select the iris dataset as the input dataset.
Run the workflow by clicking on run workflow
Question
How many history items do you have after running the workflow?
12, out of which 4 are shown and 8 hidden (at top of history right ander the history name)
Comment: Hidden datasets in history
Some workflow outputs might be considered as not very important intermediate results and are thus marked as getting hidden in the analysis history after they turned green. This makes the history easier to navigate through the main results which are visible in the history. Hidden datasets can be made visible individually by clicking on the eye with a slash on top of the history and then clicking “Unhide” for the individual datasets. To unhide many dataset at once, click galaxy-selector “Select Items” at the top left of the history; then select all hidden datasets that you would like to unhide, then click “For n of N selected” and then “Unhide”.
By starting the workflow all jobs are sent to the Galaxy cluster for analysis. Sometimes it can take a bit until the datasets show up in your history. The jobs are processed one after the other or in parallel if the same input is used for several steps. Grey means waiting to run, yellow means running and green means finished. Red means there was an error.
When something goes wrong in Galaxy, there are a number of things you can do to find out what it was. Error messages can help you figure out whether it was a problem with one of the settings of the tool, or with the input data, or maybe there is a bug in the tool itself and the problem should be reported. Below are the steps you can follow to troubleshoot your Galaxy errors.
Expand the red history dataset by clicking on it.
Sometimes you can already see an error message here
View the error message by clicking on the bug icongalaxy-bug
Check the logs. Output (stdout) and error logs (stderr) of the tool are available:
Expand the history item
Click on the details icon
Scroll down to the Job Information section to view the 2 logs:
This scenario will likely not happen with this training analysis, but might happen with a real workflow. The tool runs are scheduled on the computing infrastructures according to their consumption of cores and memory. Thus, tools that are assigned lots of cores and/or memory need to wait until an appropriate computing spot is available. Several Galaxy server display the current computational load which gives you an idea how busy it currently is.
Each dataset that turns green can already be inspected even though later datasets are still running. The second part of the training will focus on how to inspect datasets in a history.
Inspecting the analysis history
Each history item represents one file or dataset, except when collections are used. History items are numbered, duplicates are not possible because any type of dataset manipulation will automatically generate a separate dataset in the history. Some tools produce several output files and therefore the number of history items can be larger than the number of steps in a workflow. Dataset names in the analysis history are not relevant for the tool run, therefore they can be adjusted in order to make the history easier to understand. The default name of a history item is composed of the tool name that was run and the history item number(s) of the input file(s), e.g. ‘Unique on data 5’
Hands On: Inspect history
Vizualize the two scatter plots by clicking on their eye icons (view data)
If you would like to view two or more datasets at once, you can use the Window Manager feature in Galaxy:
Click on the Window Manager icon galaxy-scratchbook on the top menu bar.
You should see a little checkmark on the icon now
Viewgalaxy-eye a dataset by clicking on the eye icon galaxy-eye to view the output
You should see the output in a window overlayed over Galaxy
You can resize this window by dragging the bottom-right corner
Viewgalaxy-eye a second dataset from your history
You should now see a second window with the new dataset
This makes it easier to compare the two outputs
Repeat this for as many files as you would like to compare
You can turn off the Window Managergalaxy-scratchbook by clicking on the icon again
Show all datasets by clicking on hidden on top of your history, right below the history name
Compare the Convert csv to tabular file with the Datamash file side by side using the scratchbook
Track how the Datamash results where obtained by clicking on the Datamash item in the history and then on its i icon (view details). The performed operations can be found in the section Tool parameters
Question
What are the different Iris species?
How many lines has the Convert csv to tabular file?
Which column was grouped in during the Datamash operation?
Which column of the Remove beginning file contains sepal length and which petal length?
The 3 different Iris species are:
setosa
versicolor
virginica
151 lines (by clicking on the file one can see the line count under its name)
Column 5 (details of Datamash tool: Group by fields - 5)
Column 1 and 3 (the dataset was generated by removing the header line from data 2, thus the content of the columns is the same as in data file 2)
If you got the same answers as written in the above solution box, then congratulations! You have imported and fully reproduced the results of a previous analysis.
However, sometimes you may wish to do more, like…
Manipulating the analysis
Maybe you are interested in changing some of the original tool parameters and see how this changes the result. The parameter changes can be either done inside the workflow editor, which makes it easy to change many parameters at once (training on Using Workflow Parameters) or directly in the history. To repeat a single analysis step with new parameters this can be done directly in the Galaxy history with the re-run option.
Hands On: Manipulate the analysis steps
Rerun the Scatterplot to plot Sepal length vs. Petal length
Expand one of the output datasets of the tool (by clicking on it)
Click re-run galaxy-refresh the tool
This is useful if you want to run the tool again but with slightly different paramters, or if you just want to check which parameter setting you used.
“Column to plot on x-axis”: 1
“Column to plot on y-axis”: 3
Additional Exercise: Import a published analysis history and explore it
Often not only workflows and raw data are published, but also the full Galaxy histories. These histories can either be inspected via their provided link, or imported in order to enable manipulating them in your own Galaxy account.
Hands On: Importing a history
Import a published history shared via an EU Server account
Click on the Import this history button on the top left
Enter a title for the new history
Click on Copy History
The diamonds dataset comes from the well-known ggplot2 package developed by Hadley Wickham and was initially collected from the Diamond Search Engine in 2008.
The original dataset consists of 53940 specimen of diamonds, for which it lists the prices and various properties.
For this training, we have created a simpler dataset from the original, in which only the five columns relating to the price and the so-called 4 Cs (carat, cut, color and clarity) of diamond characteristics have been retained. The same workflow as before was used to re-analysis this second dataset and create the analysis history, which highlights the re-usability of workflows across inputs.
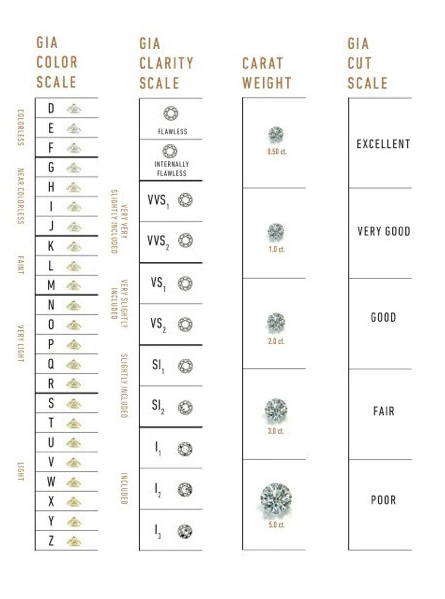
Carat refers to the weight of the diamond when measured on a scale
Cut refers to the quality of the cut and can take the grades Fair, Good, Very Good, Premium and Ideal
Color describes the overall tint, or lack thereof, of the diamond from colorless/white to yellow and is given on a letter scale ranging from D to Z (D being the best, known as colorless).
Clarity describes the amount and location of naturally occuring “inclusions” found in nearly all diamonds on a scale of eleven grades ranging from Flawless (the ideal situation) to I3 (Included level 3, the worst quality).
Question
What are the different Cut categories?
How many lines has the diamonds.csv file?
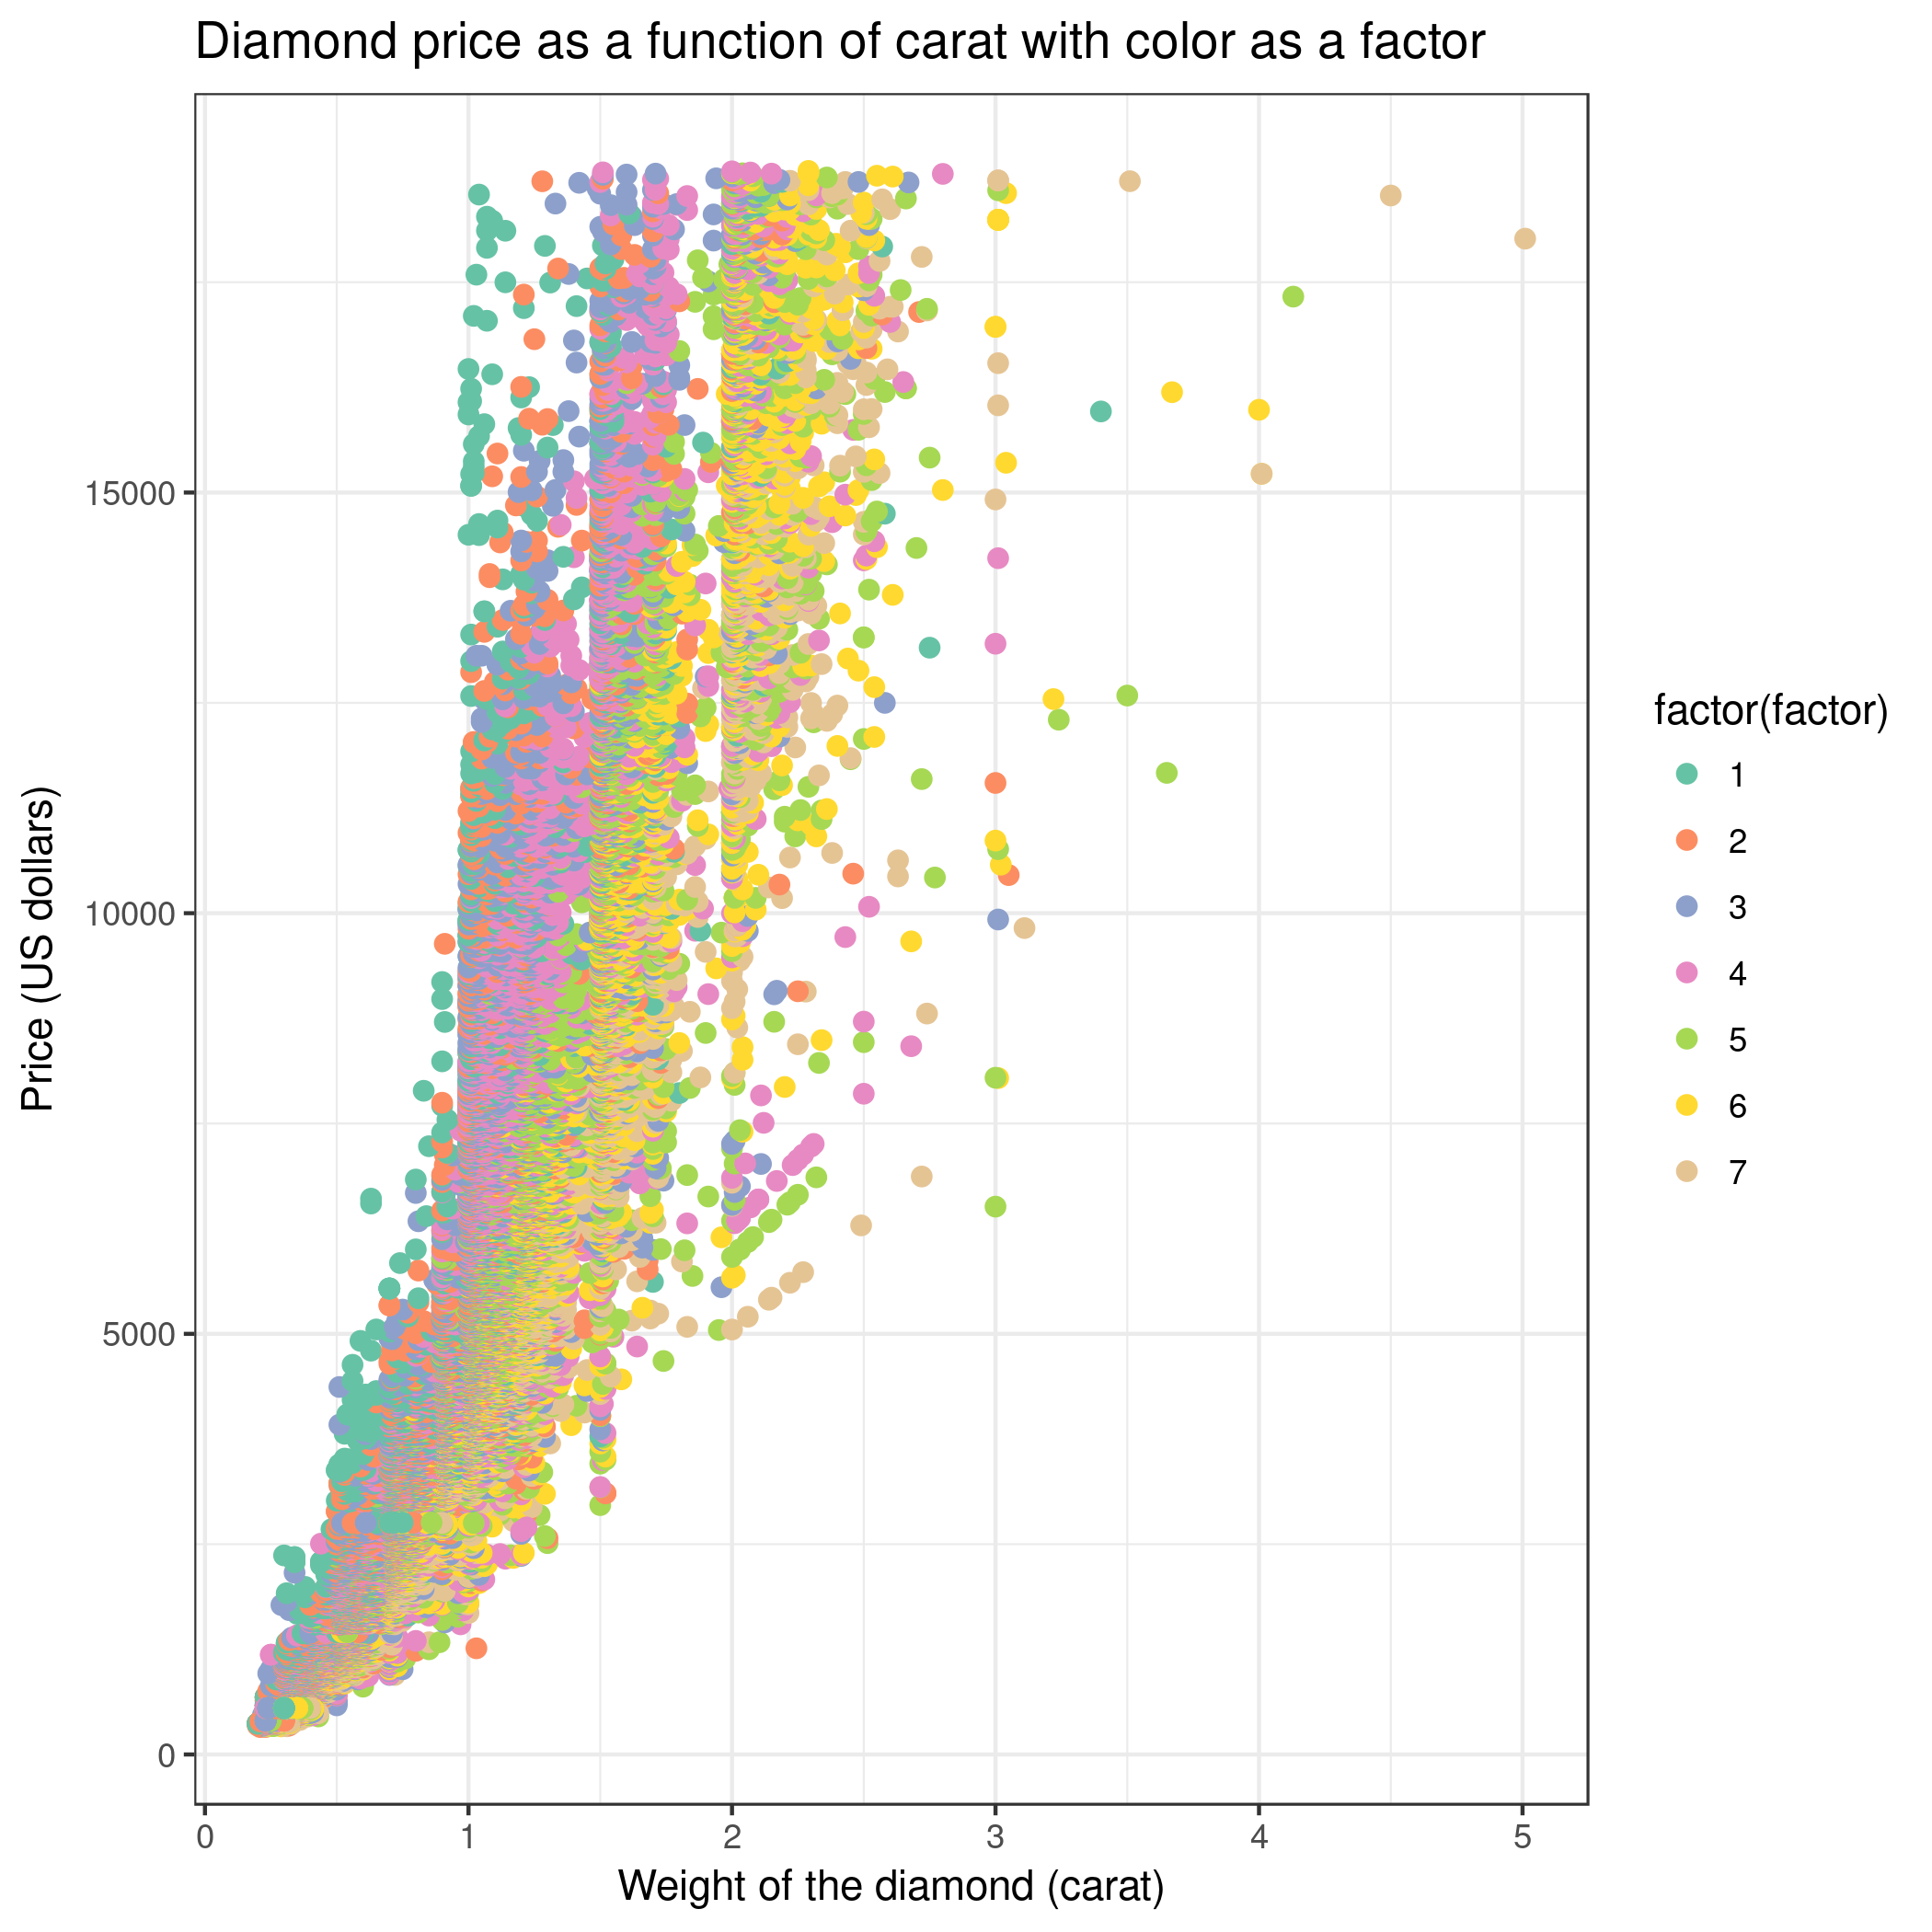
Is the color an important factor for the Diamond price?
The 5 different Cut categories are:
Fair
Good
Ideal
Premium
Very Good
53940 lines (by clicking on the file one can see the line count under its name)
We can create a new scatter plot and use color as a factor (Advanced, column differentiating the different groups: 3). Then, holding carat weight constant, we see on
the scatter plot that color is linked to the price of the diamond. So color also explains a lot of the variance found in price!
Conclusion
trophy Well done! You have just reproduced your first analysis in Galaxy.
You've Finished the Tutorial
Please also consider filling out the Feedback Form as well!
Key points
Galaxy provides an easy way to load published data into a Galaxy history
Galaxy allows to re-run a published Galaxy workflow!
Galaxy provides ways to inspect and re-use Galaxy histories
Galaxy provides an easy way to re-run tasks from histories
Frequently Asked Questions
Have questions about this tutorial? Have a look at the available FAQ pages and support channels
Afgan, E., D. Baker, B. Batut, M. van den Beek, D. Bouvier et al., 2018 The Galaxy platform for accessible, reproducible and collaborative biomedical analyses: 2018 update. Nucleic Acids Research 46: W537–W544. 10.1093/nar/gky379
Grüning, B., J. Chilton, J. Köster, R. Dale, N. Soranzo et al., 2018 Practical Computational Reproducibility in the Life Sciences. Cell Systems 6: 631–635. 10.1016/j.cels.2018.03.014
Feedback
Did you use this material as an instructor? Feel free to give us feedback on how it went.
Did you use this material as a learner or student? Click the form below to leave feedback.
Hiltemann, Saskia, Rasche, Helena et al., 2023 Galaxy Training: A Powerful Framework for Teaching! PLOS Computational Biology 10.1371/journal.pcbi.1010752
Batut et al., 2018 Community-Driven Data Analysis Training for Biology Cell Systems 10.1016/j.cels.2018.05.012
@misc{introduction-galaxy-reproduce,
author = "Melanie Föll and Anne Fouilloux",
	title = "How to reproduce published Galaxy analyses (Galaxy Training Materials)",
	year = "",
	month = "",
	day = "",
	url = "\url{https://training.galaxyproject.org/training-material/topics/introduction/tutorials/galaxy-reproduce/tutorial.html}",
	note = "[Online; accessed TODAY]"
}
@article{Hiltemann_2023,
	doi = {10.1371/journal.pcbi.1010752},
	url = {https://doi.org/10.1371%2Fjournal.pcbi.1010752},
	year = 2023,
	month = {jan},
	publisher = {Public Library of Science ({PLoS})},
	volume = {19},
	number = {1},
	pages = {e1010752},
	author = {Saskia Hiltemann and Helena Rasche and Simon Gladman and Hans-Rudolf Hotz and Delphine Larivi{\`{e}}re and Daniel Blankenberg and Pratik D. Jagtap and Thomas Wollmann and Anthony Bretaudeau and Nadia Gou{\'{e}} and Timothy J. Griffin and Coline Royaux and Yvan Le Bras and Subina Mehta and Anna Syme and Frederik Coppens and Bert Droesbeke and Nicola Soranzo and Wendi Bacon and Fotis Psomopoulos and Crist{\'{o}}bal Gallardo-Alba and John Davis and Melanie Christine Föll and Matthias Fahrner and Maria A. Doyle and Beatriz Serrano-Solano and Anne Claire Fouilloux and Peter van Heusden and Wolfgang Maier and Dave Clements and Florian Heyl and Björn Grüning and B{\'{e}}r{\'{e}}nice Batut and},
	editor = {Francis Ouellette},
	title = {Galaxy Training: A powerful framework for teaching!},
	journal = {PLoS Comput Biol}
}
Funding
These individuals or organisations provided funding support for the development of this resource
Questions:


