Galaxy’s Interface may be different to the Galaxy where you are following this tutorial.
✅ All tutorial steps will still be able to be followed (potentially with minor differences for moved buttons or changed icons.)
✅ Tools will all still work
Here we will show Galaxy features designed to help with the analysis of large numbers of samples. When you have just a few samples - clicking through them is easy. But once you’ve got hundreds - it becomes very annoying. In Galaxy we have introduced Dataset collections that allow you to combine numerous datasets in a single entity that can be easily manipulated.
Getting data
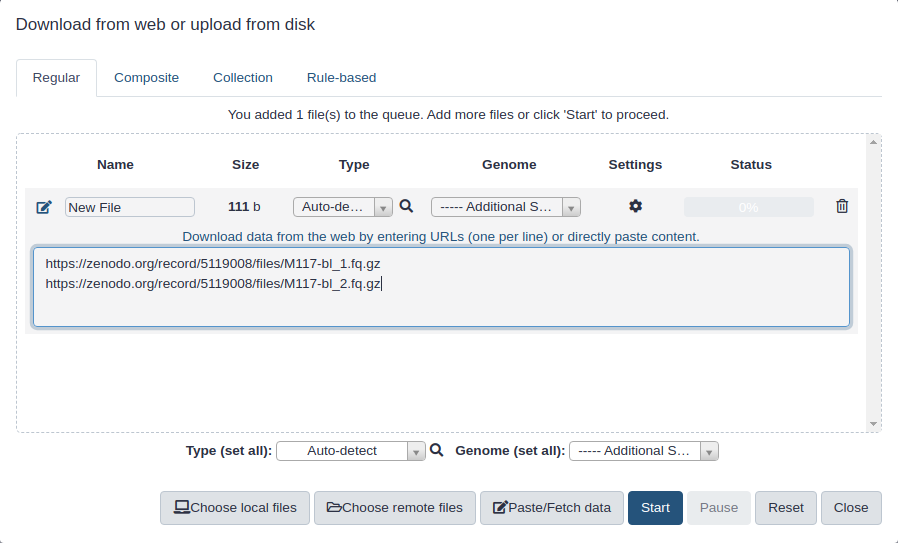
First, we need to upload datasets. Cut and paste the following URLs to Galaxy upload tool (see a tipTip on how to do this below).
The above datasets are in fastqsanger.gz format. It is necessary to explicitly set format in Galaxy. The tipTip section below explains how to upload these data and set the correct format. There is a variety of fastq format flavors and it is difficult to guess them automatically.
Copy the link location
Click galaxy-uploadUpload at the top of the activity panel
Select galaxy-wf-editPaste/Fetch Data
Paste the link(s) into the text field
Change Type (set all): from “Auto-detect” to fastqsanger.gz
Press Start
Close the window
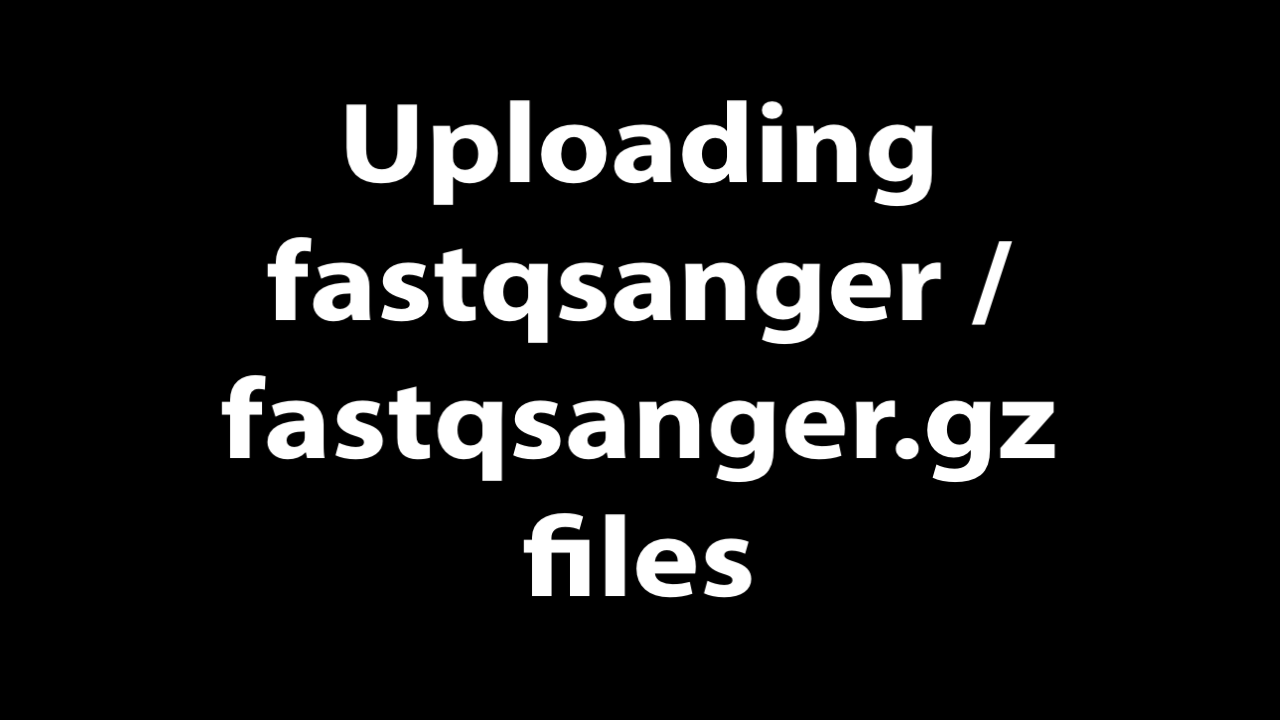
Uploading fastqsanger or fastqsanger.gz datasets via URL.
Click on Upload Data on the top of the left panel:
Click on Paste/Fetch:
Paste URL into text box that would appear:
Set Type (set all) to fastqsanger or, if your data is compressed as in URLs above (they have .gz extensions), to fastqsanger.gz
:
Warning: Danger: Make sure you choose corect format!
When selecting datatype in “Type (set all)” dropdown, make sure you select fastaqsanger or fastqsanger.gz BUT NOT fastqcssanger or anything else!
About these datasets
These datasets represent genomic DNA (enriched for mitochondria via a long range PCR) isolated from blood (bl) and cheek (buccal swab, ch) of mother (M117) and her child (M117C1) that was sequenced on an Illumina miSeq machine as paired-read library (250-bp reads; see our 2014 manuscript for Methods):
M117-bl_1 - family 117, mother, forward (F) reads from blood
M117-bl_2 - family 117, mother, reverse (R) reads from blood
M117-ch_1 - family 117, mother, forward (F) reads from cheek
M117-ch_2 - family 117, mother, reverse (R) reads from cheek
M117C1-bl_1- family 117, child, forward (F) reads from blood
M117C1-bl_2- family 117, child, reverse (R) reads from blood
M117C1-ch_1- family 117, child, forward (F) reads from cheek
M117C1-ch_2- family 117, child, reverse (R) reads from cheek
Creating a paired dataset collection
You can see that there are eight datasets forming four pairs. Obviously, we can manipulate them one-by-one (e.g., start four mapping jobs, call variants four times and so on), but this will unnecessarily tedious. Moreover, imagine if you have 100s or 1,000s of pairs: it will be impossible to process them individually.
This is exactly why we developed collections. Dataset collections allow combining multiple datasets into a single entity. Thus instead of dealing with four, a hundred, or a thousand of individual datasets you have only one item in Galaxy history to deal with.
Because our data is paired we need to create a hierarchical collection called Paired Dataset Collection or Paired Collection. In such collection there are two layers. The first layer corresponds to individual samples (e.g., M117-bl). The second layer represent forward and reverse reads corresponding to each sample:
Figure 1: The logic of Paired Collection. Here N datasets are bundled into a paired collection with two layers. The first layer corresponds to samples and the second to forward and reverse reads within each sample.
To begin creating a collection we need to select datasets we would like to bundle. This is done using checkbox button of Galaxy’s history menu. Fig. 2 below shows this process.
Figure 2: Selecting multiple datasets and creating a paired collection.
The above process ended with appearance of Galaxy collection wizard. In this case Galaxy automatically assigned pairs using the _1 and _2 endings of dataset names. Let’s however pretend that this did not happen. Click on Unpair all (highlighted in red in the figure above) link and then on Filters link (see animation in Fig. 3). The interface will change into its unpaired state.
Here datasets containing the first (forward) and the second (reverse) read are differentiated by having _1 and _2 in the filename. We can use this feature in dataset collection wizard to pair our datasets. Type _1 in the left Filter text text box and _2 in the right. You will see that the dataset collection wizard will automatically filter lists on each side of the interface. Now you can either click Auto pair if pairs look good to you (proper combinations of datasets are listed in each line) or pair each forward/reverse group individually by pressing Pair these datasets button separating each pair.
Now it is time to name the collection: type M117-collection in Name text box and create the collection by clicking Create collection. A new item will appear in the history.
Figure 3: Working with collection wizard. Text above this figure explains each step.
Clicking on collection will expand it to show four pairs it contains (panel B). Clicking individual pairs will expand them further to reveal forward and reverse datasets (panel C). Expanding these further will enable one to see individual datasets (panel D).
Figure 4: To look what is inside a collection, just click on it.
Processing data organized as a collection
By now we see that a collection can be used to bundle a large number of items into a single history item. Galaxy tools take collection as input. Let’s map reads contained in collection M117-collection against human mitochondrial genome. Before we can do this we need to upload mitochondrial genome using the following URL (see a tipTip on how to do this below):
Change Type (set all): from “Auto-detect” to fasta.gz
Press Start
Close the window
Mapping reads
BWA-MEMtool is a widely used sequence aligner for short-read sequencing datasets such as those we are analysing in this tutorial. (You can find the tool by typing BWA MEM in the search box at the top left corner of Galaxy interface).
Hands On: Map sequencing reads to reference genome
Run Map with BWA-MEM ( Galaxy version 0.7.17.1) with the following parameters:
“Will you select a reference genome from your history or use a built-in index?”: Use a genome from history and build index
param-file“Use the following dataset as the reference sequence”: chrM.fa.gz (The mitochondrial genome we just uploaded)
“Single or Paired-end reads”: Paired Collection
param-file“Select a paired collection”: M117-collection (the collection we built at the beginning of this tutorial.)
You will see jobs being submitted and new datasets appearing in the history. Because our collection contains four paired datasets Galaxy will actually generate four separate BWA-MEM jobs. In the end this BWA-MEM run will produce a new collection containing four (4) BAM datasets. Let’s look at this collection by clicking on it (panel A in the figure below). You can see that now this collection is no longer paired (compared to the collection we created in the beginning of this tutorial). This is because BWA-MEM takes forward and reverse data as input, but produces only a single BAM dataset as the output. So what we have in the result is a list of four dataset (BAM files; panel B). If you click on any of the datasets you will see that it is indeed a BAM dataset (panel C).
Calling variants
After we mapped reads against the mitochondrial genome, we can now call variants. In this step a variant calling tool lofreq will take a collection of BAM datasets (the one produced by BWA-MEM), identify differences between reads and the reference, and output these differences as a collection of VCF datasets.
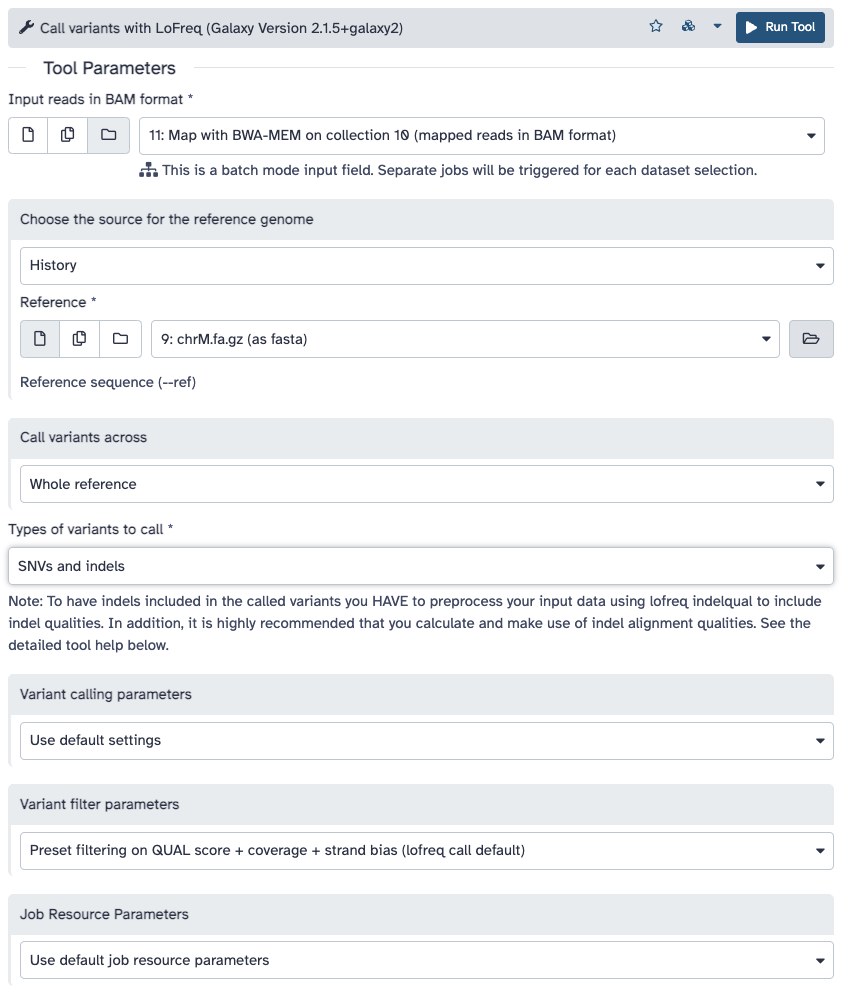
Hands On: Call variants
Run Call variants ( Galaxy version 2.1.5+galaxy1) with the following parameters:
param-file“Input reads in BAM format”: Map with BWA-MEM... (output of BWA-MEMtool)
“Choose the source for the reference genome”: History
Create table of variants using SnpSift Extract Fields
We will now convert VCF datasets into tab delimited format as it will be easier to work with. This will be done with SNPSift: a tool specifically designed for manipulation of tab-delimited data.
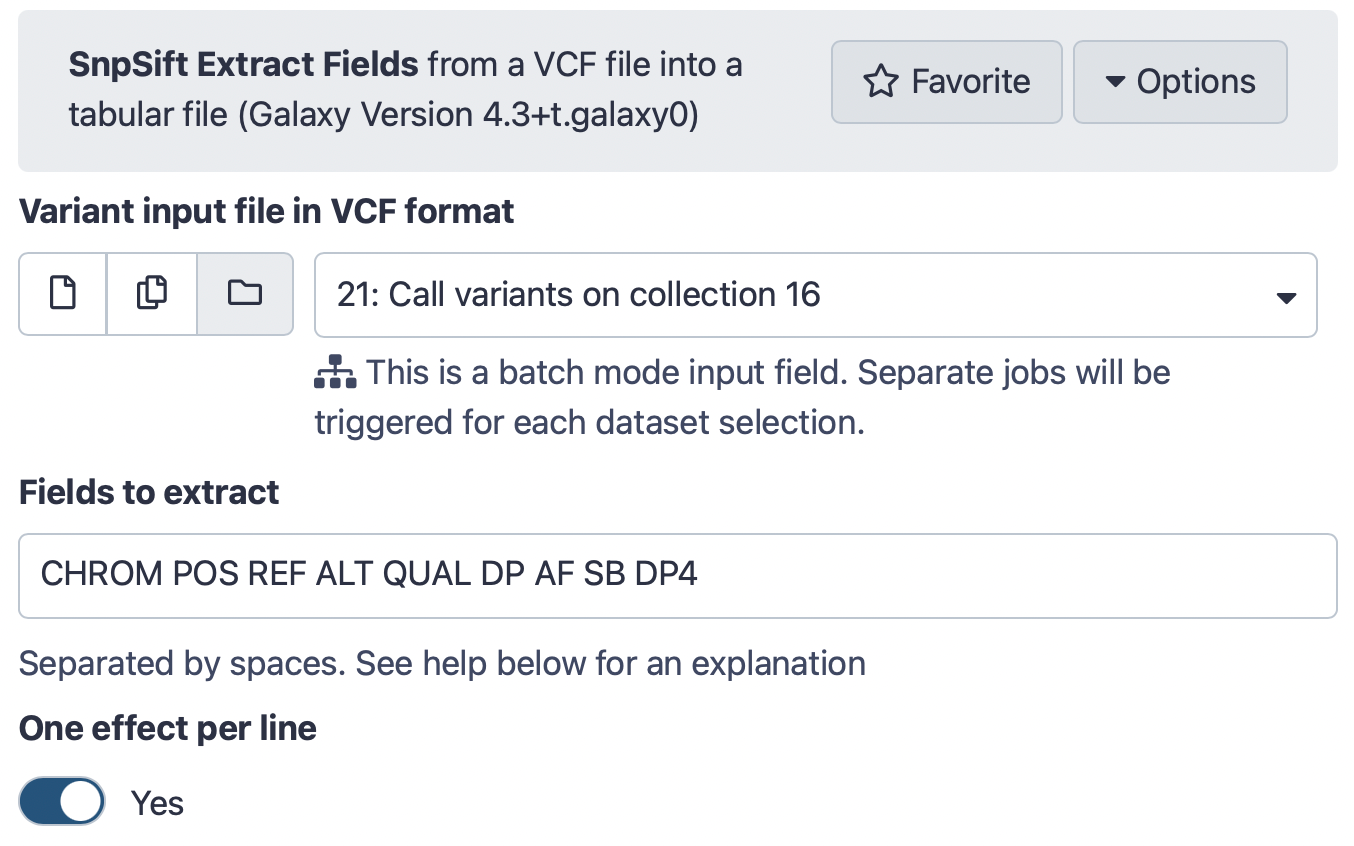
Hands On: Create table of variants
Run SnpSift Extract Fields ( Galaxy version 4.3+t.galaxy0) with the following parameters:
param-file“Variant input file in VCF format”: Call variants on collection... (output of Call variants with lofreqtool)
“Fields to extract”: CHROM POS REF ALT QUAL DP AF SB DP4
“One effect per line”: Yes
The interface should look like this:
Click Run Tool button
As a result of this operation we now have a collection of four tab delimited files. Yet, ultimately we want to summaize these data as one final table. The next step does just that.
Collapse data into a single dataset
We now extracted meaningful fields from VCF datasets. But they still exist as a collection. To move towards secondary analysis we need to collapse this collection into a single dataset. For more information about collapsing collections see this video:
Video: Collapsing collections
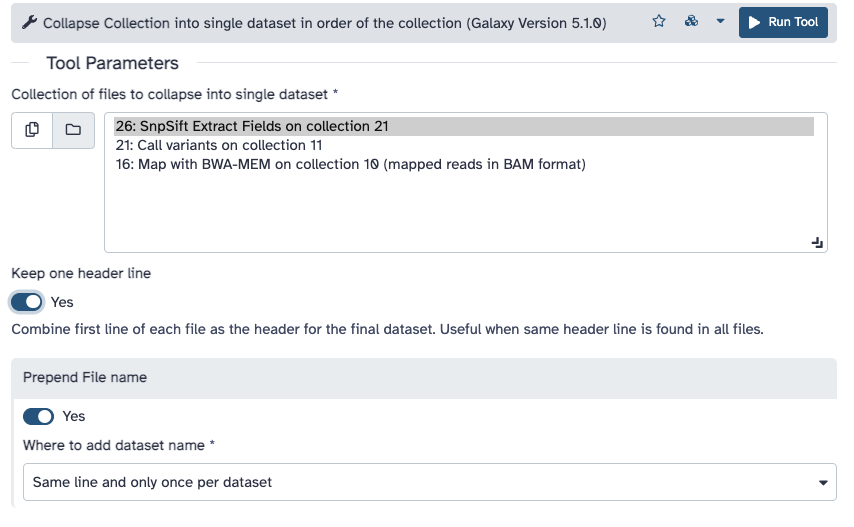
Hands On: Collapse a collection
Run Collapse Collection ( Galaxy version 4.0) with the following parameters:
param-collection“Collection of files to collapse into single dataset”: SnpSift Extract Fields ... (output of SnpSift Extract Fieldstool)
“Keep one header line”: Yes
“Prepend File name”: Yes
“Where to add dataset name”: Same line and each line in dataset
The interface should look like this:
Click Run Tool button
You can see that this tool takes lines from all collection elements (in our case we have two), add element name as the first column, and pastes everything together. So if we have a collection as an input:
Code In: A collection with two items
A collection element named M117-bl.fq
chrM   152 T C  3707.0 1242 0.99 0 2,2,540,697
chrM 16519 T C 35149.0 1033 0.99 0 1,1,611,420
A collection element named M117-ch.fq:
chrM   152 T C  4098.0 1440 0.99 0 0,1,575,863
chrM 16519 T C 36574.0 1039 0.99 2 3,0,713,321
A collection element named M117C1-bl.fq:
chrM   152 T C  4888.0 1235 1.00 0 0,0,548,687
chrM 16519 T C 35220.0 1042 0.99 0 0,0,598,443
A collection element named M117C1-ch.fq:
chrM   152 T C  2757.0 1413 0.99 0 2,2,576,833
chrM 16455 G A    54.0  100 0.04 0 89,7,4,0
chrM 16519 T C 36363.0 1061 0.99 6 3,4,691,362
We will have a single dataset as the output:
Code Out: A single dataset
then the Collapse Collectiontool will produce this:
M117-bl.fq   chrM   152 T C  3707.0 1242 0.99 0 2,2,540,697
M117-bl.fq   chrM 16519 T C 35149.0 1033 0.99 0 1,1,611,420
M117-ch.fq   chrM   152 T C  4098.0 1440 0.99 0 0,1,575,863
M117-ch.fq   chrM 16519 T C 36574.0 1039 0.99 2 3,0,713,321
M117C1-bl.fq chrM   152 T C  4888.0 1235 1.00 0 0,0,548,687
M117C1-bl.fq chrM 16519 T C 35220.0 1042 0.99 0 0,0,598,443
M117C1-ch.fq chrM   152 T C  2757.0 1413 0.99 0 2,2,576,833
M117C1-ch.fq chrM 16455 G A    54.0  100 0.04 0 89,7,4,0
M117C1-ch.fq chrM 16519 T C 36363.0 1061 0.99 6 3,4,691,362
you can see that added a column with dataset ID taken from collection element name.
We did not fake this:
The history described in this page is accessible directly from here:
From there you can import histories to make them your own.
Collection operations
In this brief analysis we took four paired datasets, created a collection, analyzed this collection and finally created a single report. Such “lifecycle” is shown in the figure below. Here we started with eight fastq datasets representing four paired end samples. A paired collection was reduced to a list of BAM datasets by BWA-MEM. Varinat calling by lofreq and field extraction with SnpEff maintained collection structure: these tools processed four individual datasets changing their formats from BAM to VCF, and from VCF to Tab-delimited. Finally, we collapsed collection by merging its content into a single dataset.
Figure 6: Collection lifecycle. Arrows = individual fastq datasets; Four shades of yellow = four samples analyzed in this example.
The last step of our analysis, collapsing a collection, is an example of a collection operation. Galaxy contains an entire section of tools designed for handling of collection data. These can be classified as:
Tools that manipulate elements within a collection
Tools that change collection structure
Tools that combine elements of a collection
Let’s look at these categories in more detail:
Tools that manipulate elements within a collection
Extract dataset
toolExtract dataset extracts datasets from a collection based on either position or identifier.
The tool allow extracting datasets based on position (The first dataset and Select by index options) or name (Select belement identifier option). This tool effectively collapses the inner-most collection into a dataset. For nested collections (e.g a list of lists of lists: outer:middle:inner, extracting the inner dataset element) a new list is created where the selected element takes the position of the inner-most collection (so outer:middle, where middle is not a collection but the inner dataset element).
Filter empty
toolFilter empty removes empty elements from a collection.
This tool takes a dataset collection and filters out (removes) empty datasets. This is useful for continuing a multi-sample analysis when downstream tools require datasets to have content.
Filter failed datasets
toolFilter failed datasets removes datasets in error (red) from a collection.
This tool takes a dataset collection and filters out (removes) datasets in the failed (red) state. This is useful for continuing a multi-sample analysis when one or more of the samples fails at some point.
Build list
toolBuild list creates a new list collection from individual datasets or collections.
This tool combines individual datasets or collections into a new collection. The simplest scenario is building a new colection from individual datasets (case A in the image below). You can merge a collection with individual dataset(s). In this case (see B in the image below) the individual dataset(s) will be merged with each element of the input collection to create a nested collection. Finally, two or more collection can be merged together creating a nested collection (case C in the image below).
Filter collection
toolFilter collection removes elements from a collection using a list supplied in a file.
This tools allow filtering elements from a data collection. It takes an input collection and a text file with names (i.e. identifiers). The tool behaviour is controlled by How should the elements to remove be determined? drop-down. It has the following options:
toolRelabel identifiers changes identifiers of datasets within a collection using identifiers from a supplied file.
New identifiers can be supplied as either a simple list or a tab-delimited file mapping old identifier to the new ones. This is controlled using How should the new identifiers be specified? drop-down:
toolSort collection sorts dataset collection alphabetically, numerically, or using predetermined order from a supplied file.
Numeric sort
The tool sort in ascending order. When numeric sort is chosen, the tool ignores non-numeric characters. For example, if a collection contains the following elements:
 Collection: [Horse123]
             [Donkey543]
             [Mule176]
The tool will output:
 Collection: [Horse123]
             [Mule176]
             [Donkey543]
Sorting from file
Alternative, one can supply a single column text file containing elements identifiers in the desired sort order. For example, suppose there a collection:
 Collection: [Horse123]
             [Donkey543]
             [Mule176]
and a file specifying sort order:
 Donkey543
 Horse123
 Mule176
the output will predictably look like this:
 Collection: [Donkey543]
             [Horse123]
             [Mule176]
Tag collection
toolTag collection adds tags (including name: and group: tags) to collection elements.
The relationship between element names and tags is specified in a two column tab-delimited file. This file may contain less entries than elements in the collection. In that case only matching list identifiers will be tagged.
To create name: or group: tags prepend them with # (you can also use name:) or group:, respectively.
More about tags
Galaxy allows tagging datasets to facilitate analyses. There are several types of tags including simple tags, name tags, and group tags. Simple tags allow you to attach an alternative label to a dataset, which will make it easier to find it later. Name tags allow you to track propagation of a dataset through the analyses: all datasets derived from the initial dataset labeled with a name tag will inherit it. Finally, group tags allow you to label group of datasets. This is useful. for example, for differential expression analysis where you can have two groups of datasets labeled as “treatment” and “control”.
toolFlatten collection collapses nested collection into a simple list.
This tool takes nested collections such as a list of lists or a list of dataset pairs and produces a flat list from the inputs. It effectively “flattens” the hierarchy. The collection identifiers are merged together (using _ as default) to create new collection identifiers in the flattened result:
Merge collections
toolMerge collections takes two or more collections and creates a single collection from them.
By default the tool assumes that collections that are being merged have unique dataset names. If it not the case only one (the first) of the datasets with a repeated name will be included in the merged collection. For example, suppose you have two collections. Each has two datasets named “A” and “B”:
toolZip collection takes two collections and creates a paired collection from them.
If you have one collection containing only forward reads and one containing only reverse, this tools will “zip” them together into a simple paired collection. For example, given two collections with forward and reverse reads they can be “zipped” into a single paired collection:
Unzip collection
toolUnzip collection takes a paired collection and “unzips” it into two simple dataset collections (lists of datasets).
Given a paired collection of forward and reverse reads this tool will “unzip” it into two collections containing forward and reverse reads, respectively:
Tools that combine elements of a collection
Column join
toolColumn join merges elements of a collection on a given column.
If you have a collection with three elements (image below), merging it on the first column will first produce a union on values found in the first column of each elements and then paste elements having the same value side-by-side:
Collapse collection
toolCollapse collection merges elements together (head-to-tail) in the order of the collection. Its power comes from the ability to add identifiers when it performs the merge. Identifiers can be added in variety of ways specified by the Prepend File name option as shown in the figure below (we used option A in the last step of this tutorial). A = Same line and each line in dataset; B = Same line and only once per dataset; C = Line above
You've Finished the Tutorial
Please also consider filling out the Feedback Form as well!
Key points
Multiple datasets can be combined in a collection.
This significantly simplifies the analysis.
This tutorial showed how to (1) create collection, (2) run tools on a collection, (3) combine collection elements into a final analysis results.
There is a variety of Collection operation tools allowing to perform a variety of transformations.
Frequently Asked Questions
Have questions about this tutorial? Have a look at the available FAQ pages and support channels
Did you use this material as an instructor? Feel free to give us feedback on how it went.
Did you use this material as a learner or student? Click the form below to leave feedback.
Hiltemann, Saskia, Rasche, Helena et al., 2023 Galaxy Training: A Powerful Framework for Teaching! PLOS Computational Biology 10.1371/journal.pcbi.1010752
Batut et al., 2018 Community-Driven Data Analysis Training for Biology Cell Systems 10.1016/j.cels.2018.05.012
@misc{galaxy-interface-collections,
author = "Anton Nekrutenko",
	title = "Using dataset collections (Galaxy Training Materials)",
	year = "",
	month = "",
	day = "",
	url = "\url{https://training.galaxyproject.org/training-material/topics/galaxy-interface/tutorials/collections/tutorial.html}",
	note = "[Online; accessed TODAY]"
}
@article{Hiltemann_2023,
	doi = {10.1371/journal.pcbi.1010752},
	url = {https://doi.org/10.1371%2Fjournal.pcbi.1010752},
	year = 2023,
	month = {jan},
	publisher = {Public Library of Science ({PLoS})},
	volume = {19},
	number = {1},
	pages = {e1010752},
	author = {Saskia Hiltemann and Helena Rasche and Simon Gladman and Hans-Rudolf Hotz and Delphine Larivi{\`{e}}re and Daniel Blankenberg and Pratik D. Jagtap and Thomas Wollmann and Anthony Bretaudeau and Nadia Gou{\'{e}} and Timothy J. Griffin and Coline Royaux and Yvan Le Bras and Subina Mehta and Anna Syme and Frederik Coppens and Bert Droesbeke and Nicola Soranzo and Wendi Bacon and Fotis Psomopoulos and Crist{\'{o}}bal Gallardo-Alba and John Davis and Melanie Christine Föll and Matthias Fahrner and Maria A. Doyle and Beatriz Serrano-Solano and Anne Claire Fouilloux and Peter van Heusden and Wolfgang Maier and Dave Clements and Florian Heyl and Björn Grüning and B{\'{e}}r{\'{e}}nice Batut and},
	editor = {Francis Ouellette},
	title = {Galaxy Training: A powerful framework for teaching!},
	journal = {PLoS Comput Biol}
}
Congratulations on successfully completing this tutorial!
You can use Ephemeris's shed-tools install command to install the tools used in this tutorial.
5 stars:
Liked: A feasible training on how to create a paired dataset collection that allows combining multiple datasets into a single entity, making analysis of multiple datasets in one piece. Mapping reads using the BWA-MEM tool for sequence alignment against a reference genome. Using a variant calling tool, lofreq that takes BAM datasets identifying the differences between reads and the reference, outputting these differences as a collection of VCF datasets.
5 stars:
Liked: fun and usefull
Disliked: update the hands-on with more recent version of Galaxy. Some tasks have a total different name in the newer version compared with this hands-on tasks
May 2026
5 stars:
Liked: I liked how the tutorial clearly explained dataset collections and demonstrated how multiple datasets can be combined into a single collection to simplify analysis
Disliked: The tutorial was very clear and well designed. The explanations, examples, and visual guidance were sufficient and made the workflow easy to understand.
5 stars:
Liked: Simple and useful
5 stars:
Liked: Easy to follow :) And with the video tutorial next to it, it was perfect :)
5 stars:
Liked: Easy to follow, well chosen example
June 2025
5 stars:
Liked: I loved how to create list and work on collections. That's a great hack for working with multiple datasets.
May 2025
5 stars:
Liked: flowcharts of the tutorials made it easy to visualize the backend processes
5 stars:
Liked: Interactive Tutorial and all the Tools and parameters are well explained
5 stars:
Liked: clear explanation for all the tools and easy to follow
2 stars:
Liked: It gave a clear explaination on how to organise data in Galaxy.
Disliked: I got a bit lost from the point of mapping reads.
5 stars:
Liked: Very easy to understand and detailed! Images helped a lot!
Disliked: There were some discrepancies between the text and images and some minor typing errors like "SnpEff" instead of "SnpSift" which could be corrected to avoid any confusion. I have taken screenshots but have no option to upload here.
4 stars:
Liked: This tutorial gives an overall description on how to manipulate collections. It will be useful on my future analysis.
Disliked: The figures move to quickly and are difficult to read
5 stars:
Liked: The power-user of dataset collections.
Disliked: I will add some examples with collection operqtions! Just to become more confident rapidly.
5 stars:
Liked: The additional introduction of tools
Disliked: At the step "Collapse Collection" does not match the parameters. While the named parameters write ""Where to add dataset name": Sam line and each line in dataset", the picture shows "Same line and only once per dataset". This could be changed for less confusion :)
5 stars:
Liked: It was partially new to me. So, everything.
Disliked: Don't know
4 stars:
Liked: I liked the simple and useful workflow, and the video was great!
Disliked: Some typos and specify in the tool input, that it is needed to click on the dataset collection icon, as the default single dataset will not find any input on this tutorial history.
5 stars:
Liked: I like the step-by-step flow of the instructions for analysing big samples and collecting them into a single dataset. The instructions were easy to follow.
5 stars:
Liked: I had doubts about how to label a sample and now I understand it
Disliked: I can't find the excercises
Questions:
:
Warning: Danger: Make sure you choose corect format!

 Open image in new tab
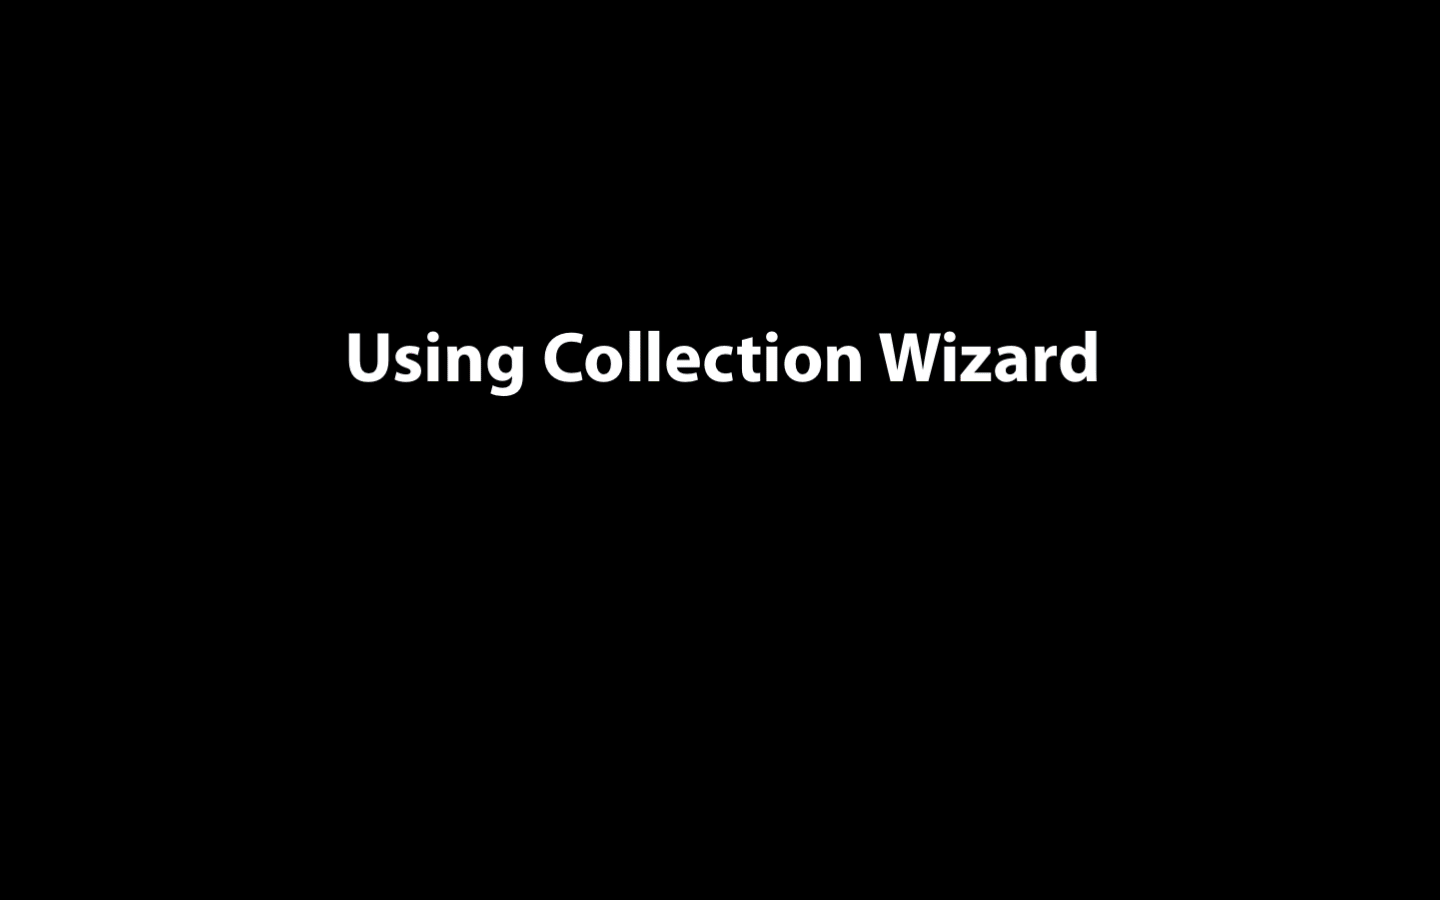 Open image in new tab
 Open image in new tab
Open image in new tab