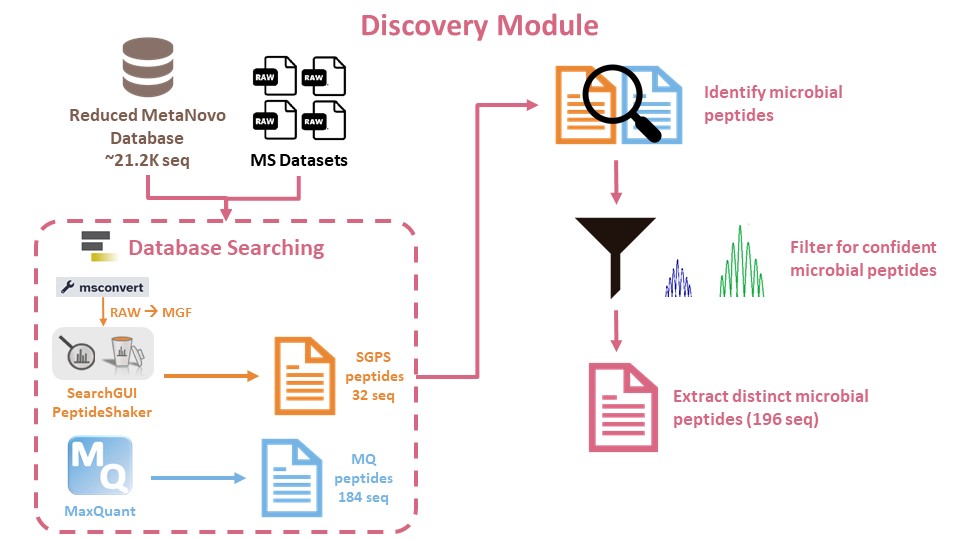
This tutorial can be followed with any user-defined database but would work best if the clinical metaproteomics database generation module was used (see Database Generation tutorial). The MetaNovo tool generates a more manageable database that contains identified proteins. The MetaNovo-generated database merged with Human SwissProt (reviewed only) and contaminants (cRAP) databases to generate a compact database (~21.2k protein sequences) that will be used for peptide identification.
Peptide identification
The MSMS data will be searched against the compact database Human UniProt Microbial Proteins (from MetaNovo) and cRAP to identify peptide and protein sequences via sequence database searching. For this tutorial, two peptide identification programs will be used: SearchGUI/PeptideShaker and MaxQuant. However, you could use other software too, such as Fragpipe or Scribe. For the purpose of this tutorial, a dataset of the 4 RAW/MGF files will be used as the MS/MS input.
This step is to identify proteins based on mass spectrometry data. The algorithms identify peptides in the spectra and search a protein sequence database to match observed peptide data with theoretical peptide masses and spectra. Scoring and false discovery rate control help assess the reliability of matches, followed by protein inference to determine the proteins present in the sample. These algorithms are essential for interpreting mass spectrometry data, aiding in protein identification, quantification, and insights into biological processes and disease mechanisms in proteomics research.
Get data
Hands On: Data Upload
Create a new history for this tutorial
Import the files from Zenodo or from
the shared data library (GTN - Material -> proteomics
-> Clinical Metaproteomics 2: Discovery):
Click galaxy-uploadUpload at the top of the activity panel
Select galaxy-wf-editPaste/Fetch Data
Paste the link(s) into the text field
Press Start
Close the window
As an alternative to uploading the data from a URL or your computer, the files may also have been made available from a shared data library:
Go into Libraries (left panel)
Navigate to the correct folder as indicated by your instructor.
On most Galaxies tutorial data will be provided in a folder named GTN - Material –> Topic Name -> Tutorial Name.
Select the desired files
Click on Add to Historygalaxy-dropdown near the top and select as Datasets from the dropdown menu
In the pop-up window, choose
“Select history”: the history you want to import the data to (or create a new one)
Click on Import
Rename the datasets
Check that the datatype
Click on the galaxy-pencilpencil icon for the dataset to edit its attributes
In the central panel, click galaxy-chart-select-dataDatatypes tab on the top
In the galaxy-chart-select-dataAssign Datatype, select datatypes from “New Type” dropdown
Tip: you can start typing the datatype into the field to filter the dropdown menu
Click the Save button
Add to each database a tag corresponding to user.
Create a dataset collection of all the raw files and MGF files.
Datasets can be tagged. This simplifies the tracking of datasets across the Galaxy interface. Tags can contain any combination of letters or numbers but cannot contain spaces.
To tag a dataset:
Click on the dataset to expand it
Click on Add Tagsgalaxy-tags
Add tag text. Tags starting with # will be automatically propagated to the outputs of tools using this dataset (see below).
Press Enter
Check that the tag appears below the dataset name
Tags beginning with # are special!
They are called Name tags. The unique feature of these tags is that they propagate: if a dataset is labelled with a name tag, all derivatives (children) of this dataset will automatically inherit this tag (see below). The figure below explains why this is so useful. Consider the following analysis (numbers in parenthesis correspond to dataset numbers in the figure below):
a set of forward and reverse reads (datasets 1 and 2) is mapped against a reference using Bowtie2 generating dataset 3;
dataset 3 is used to calculate read coverage using BedTools Genome Coverageseparately for + and - strands. This generates two datasets (4 and 5 for plus and minus, respectively);
datasets 4 and 5 are used as inputs to Macs2 broadCall datasets generating datasets 6 and 8;
datasets 6 and 8 are intersected with coordinates of genes (dataset 9) using BedTools Intersect generating datasets 10 and 11.
Now consider that this analysis is done without name tags. This is shown on the left side of the figure. It is hard to trace which datasets contain “plus” data versus “minus” data. For example, does dataset 10 contain “plus” data or “minus” data? Probably “minus” but are you sure? In the case of a small history like the one shown here, it is possible to trace this manually but as the size of a history grows it will become very challenging.
The right side of the figure shows exactly the same analysis, but using name tags. When the analysis was conducted datasets 4 and 5 were tagged with #plus and #minus, respectively. When they were used as inputs to Macs2 resulting datasets 6 and 8 automatically inherited them and so on… As a result it is straightforward to trace both branches (plus and minus) of this analysis.
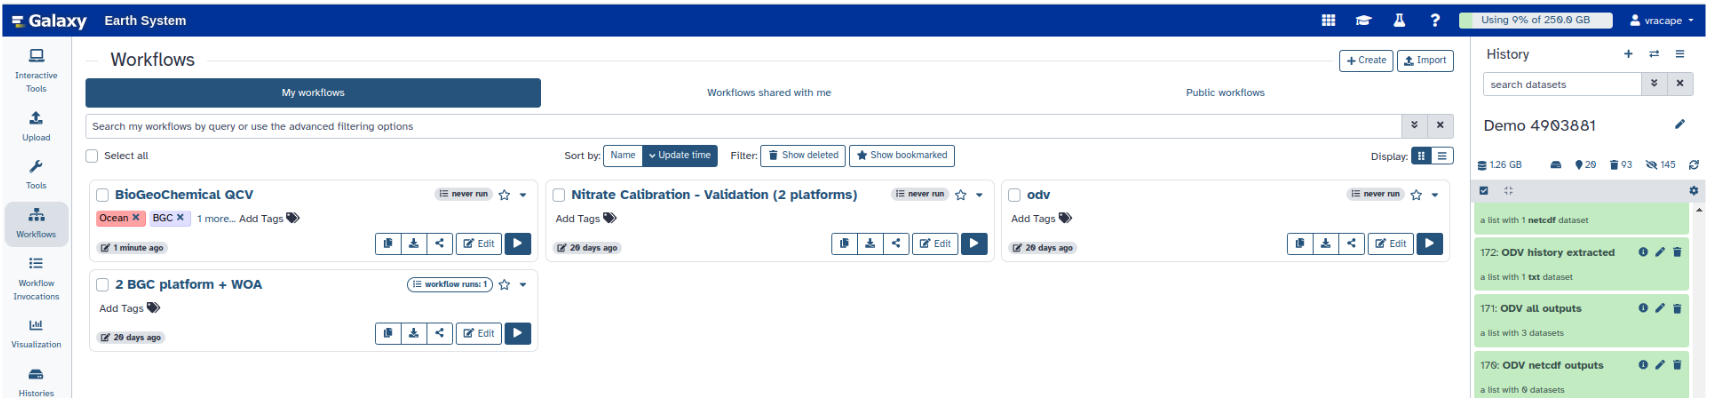
Click on galaxy-workflows-activityWorkflows in the Galaxy activity bar (on the left side of the screen, or in the top menu bar of older Galaxy instances). You will see a list of all your workflows
Click on galaxy-uploadImport at the top-right of the screen
Paste the following URL into the box labelled “Archived Workflow URL”: https://training.galaxyproject.org/training-material/topics/proteomics/tutorials/clinical-mp-2-discovery/workflows/WF2_Discovery-Workflow.ga
Click the Import workflow button
Below is a short video demonstrating how to import a workflow from GitHub using this procedure:
Video: Importing a workflow from URL
Run Workflowworkflow using the following parameters:
“Send results to a new history”: No
param-file” RAW files”: RAW dataset collection
param-file” Human UniProt Microbial Proteins (from MetaNovo) and cRAP”: Human_UniProt_Microbial_Proteins_(from_MetaNovo)_and_cRAP.fasta
Click on Workflows on the Activity Bar on the left.
At the top of the resulting page you will have the option to switch between the My workflows, Workflows shared with me and Public workflows tabs.
Select the tab you want to see all workflows in that category
Search for your desired workflow.
Click on the workflow name: a pop-up window opens with a preview of the workflow.
To run it directly: click Run (top-right).
Recommended: click Import (left of Run) to make your own local copy under Workflows / My Workflows.
Peptide identification
Using the compact database generated by MetaNovo as the input database, we will match MS/MS data to peptide sequences via sequence database searching.
For this tutorial, two peptide identification programs will be used: SearchGUI/PeptideShaker and MaxQuant. For both programs, the created dataset of the four MS datasets in the history will be used as the MS/MS input. The RAW MS/MS data files will be converted into mascot generic format (MGF) files as that is the standard format in which MS/MS searches are performed.
Peptides identified from each program will be verified with the PepQuery tool to generate a master list of confident verified microbial peptides.
Appending decoy sequenced to FASTA database with FastaCLI
Using the FastaCLI tool, decoy sequences will be appended to the FASTA database. Decoy sequences are protein sequences are not expected to be present in samples. For more information on how to generate and append decoy sequences, see GTN Protein FASTA Database Handling.
Hands On: FastaCLI
FastaCLI ( Galaxy version 4.0.41+galaxy1) with the following parameters:
The msconvert tool allows for the conversion of mass spectrometry data files between different formats, such as thermo.raw, mgf, or mzml.
Hands On: msconvert: RAW to MGF
msconvert ( Galaxy version 3.0.20287.2) with the following parameters:
param-collection“Input unrefined MS data”: output (Input dataset collection)
“Do you agree to the vendor licenses?”: Yes
“Output Type”: mgf
In “Data Processing Filters”:
“Apply peak picking?”: Yes
“(Re-)calculate charge states?”: no
Question
Why do we need to use MGF instead of RAW files for Search GUI?
SearchGUI is compatible only with MGF files, hence you have to use msconvert or Thermofile converter tools to convert the RAW format to MGF fomat.
Perform Database searching with Search GUI
SearchGUI is a database-searching tool that comprises different search engines to match sample MS/MS spectra to known peptide sequences. In our analysis, we will use X!Tandem and MS-GF+ as search algorithms within SearchGUI for matching spectra from mass spectrometry data against peptides from the protein sequence database.
The SearchGUI tool will perform a database search based on the parameters we’ve set and will generate a file (called a SearchGUI archive file) that will serve as the input for the PeptideShaker tool. The SearchGUI archive file contains Peptide-Spectral Matches (PSMs), and PeptideShaker is a post-processing software that will assess the confidence of the data. PeptideShaker also infers the identities of proteins based on the matched peptide sequences, and users are able to visualize these outputs to interpret results. More information about database searching using SearchGUI and PeptideShaker is accessible at Metaproteomics tutorial.
Hands On: Peptide discovery using SearchGUI
Search GUI ( Galaxy version 4.0.41+galaxy1) with the following parameters:
param-file“Identification Parameters file”: Identification_Parameters_File (output of Identification Parameterstool)
param-file“Fasta file”: input_database_concatenated_target_decoy (output of FastaCLItool)
param-file“Input Peak Lists”: output (output of msconverttool)
“SearchGUI Options”: Default
Question
Why do we need to add decoy sequences to our FASTA database for Search GUI? And how many do we need to add?
Adding decoy sequences helps in FDR estimation, discriminating true positives from false positives, and quality control of the data. The number of decoy sequences you need to add to your database depends on the desired FDR level you want to achieve. A common practice is to use a 1:1 ratio of target sequences to decoy sequences. In other words, for every real protein sequence in your database, you would add a decoy sequence. This allows you to estimate the FDR at 1%, 5%, or any other chosen threshold.
Question
What is the Identification Parameters tool?
Identification Parameters tool is an input required by the search GUI tool, it contains all the parameters required to run the search algorithms.
Post-processing of SearchGUI output using with Peptide Shaker
Hands On: Peptide Shaker
Peptide Shaker ( Galaxy version 2.0.33+galaxy1) with the following parameters:
param-file“Compressed SearchGUI results”: searchgui_results (output of Search GUItool)
In “Exporting options”:
“Follow-up analysis export options”: Do not export
“Identification features reports to be generated”: PSM ReportPeptide ReportProtein ReportCertificate of Analysis
Question
What are the differences between the following reports from PeptideShaker: PSM report, Peptide report, and Protein report?
PSM reports focus on individual peptide-spectrum matches, providing detailed information about each spectrum and its assigned peptide sequence. Peptide reports summarize information about unique peptides and their properties. Protein reports, on the other hand, focus on proteins, including protein inference, grouping, and quantification, making them more suitable for understanding the overall protein composition in a sample. These reports serve different purposes in proteomic data analysis and are used to extract various levels of information from mass spectrometry results.
Using Text Manipulation Tools to Manage Microbial Outputs from SearchGUI/PeptideShaker
Hands On: Selecting microbial peptides from SearchGUI/PeptideShaker with Select tool
Select with the following parameters:
param-file“Select lines from”: output_peptides (output of Peptide Shakertool)
“that”: NOT Matching
“the pattern”: (_HUMAN)|(_REVERSED)|(REV_)|(CON)|(con)
“Keep header line”: Yes
Question
What is the purpose of this step?
This step is to extract microbial peptides or to remove any peptides that match humans, reverse, contaminants, etc.
Hands On: Selecting microbial PSMs from SearchGUI/PeptideShaker with Select
Select with the following parameters:
param-file“Select lines from”: output_psm (output of Peptide Shakertool)
“that”: NOT Matching
“the pattern”: (_HUMAN)|(_REVERSED)|(REV_)|(CON)|(con)
“Keep header line”: Yes
Hands On: Filtering confident microbial peptides from SGPS with Filter
Filter with the following parameters:
param-file“Filter”: out_file1 (output of Selecttool)
“With following condition”: c17=='Confident'
“Number of header lines to skip”: 1
Question
In the Filtering steps, what does “Confidence” mean quantitatively, i.e. what is the percentage cutoff?
The term “Confidence” in the context of proteomic data analysis often refers to a measure of how reliable or trustworthy a particular protein or peptide identification is. However, the specific numerical value or percentage cutoff for confidence can vary depending on the software or approach you are using and the goals of your analysis. In many proteomics studies, researchers use a false discovery rate (FDR) to set a quantitative confidence threshold. Here we have set it as 1%FDR, which means that you’re accepting only 1% or less of your reported identifications as likely to be false positives.
Hands On: Filtering confident microbial PSMs from SGPS with Filter
Filter with the following parameters:
param-file“Filter”: out_file1 (output of Selecttool)
“With following condition”: c24=='Confident'
“Number of header lines to skip”: 1
We will generate and merge the Human SwissProt Protein Database and contaminants (cRAP) and convert the resulting FASTA file to a tabular file that will be used in the Query Tabular tool to generate distinct microbial peptides from SearchGUI/PeptideShaker.
Hands On: Merging Human SwissProt and cRAP databases for Query Tabular with FASTA Merge Files and Filter Unique Sequences
FASTA Merge Files and Filter Unique Sequences ( Galaxy version 1.2.0) with the following parameters:
“Run in batch mode?”: Merge individual FASTAs (output collection if input is collection)
In “Input FASTA File(s)”:
param-repeat“Insert Input FASTA File(s)”
param-file“FASTA File”: Human Swissprot Protein Database (output of Protein Database Downloadertool)
param-file“FASTA File”: Contaminants cRAP database (output of Protein Database Downloadertool)
Hands On: Converting FASTA sequences to TAB-delimited file with FASTA-to-Tabular
FASTA-to-Tabular ( Galaxy version 1.1.0) with the following parameters:
param-file“Convert these sequences”: output (output of FASTA Merge Files and Filter Unique Sequencestool)
Hands On: Filtering out accession numbers from TAB-delimited file with Filter Tabular
Filter Tabular ( Galaxy version 3.3.0) with the following parameters:
param-file“Tabular Dataset to filter”: output (output of FASTA-to-Tabulartool)
In “Filter Tabular Input Lines”:
param-repeat“Insert Filter Tabular Input Lines”
“Filter By”: select columns
“enter column numbers to keep”: 1
param-repeat“Insert Filter Tabular Input Lines”
“Filter By”: regex replace value in column
“enter column number to replace”: 1
“regex pattern”: ^[^|]+[|]([^| ]+).*$
“replacement expression”: \1
Question
What’s the difference between a FASTA and Tabular output?
FASTA Output: Typically used to report identified peptide or protein sequences, which are useful for building or updating sequence databases, for downstream sequence analysis, or for re-searching against the sequences.
Tabular Output: Used for presenting various information related to identified peptides or proteins, such as accession numbers, scores, abundance values, and other attributes. Tabular output facilitates data analysis, comparisons, and custom data processing.
Hands On: Querying protein accession numbers and peptide sequences of confident microbial PSMs (from SGPS) with Query Tabular
Query Tabular ( Galaxy version 3.3.0) with the following parameters:
In “Database Table”:
param-repeat“Insert Database Table”
param-file“Tabular Dataset for Table”: out_file1 (output of Filtertool)
“SQL Query to generate tabular output”: SELECT id,Proteins,Sequence FROM psms WHERE psms.ln NOT IN (SELECT distinct prots.ln FROM prots JOIN Uniprot ON prots.prot = Uniprot.prot) ORDER BY psms.ln
“include query result column headers”: Yes
Hands On: Cutting out peptide sequences from Query Tabular with Cut
Cut with the following parameters:
“Cut columns”: c3
param-file“From”: output (output of Query Tabulartool)
Hands On: Grouping distinct (unique) peptides from SGPS with Group
Group with the following parameters:
param-file“Select data”: out_file1 (output of Cuttool)
“Group by column”: c1
Perform peptide discovery with MaxQuant
MaxQuant is an MS-based proteomics platform that is capable of processing raw data and provides improved mass precision and high precursor mass accuracy (HPMA), which resulted in increased protein identification and more in-depth proteomic analysis. Raw MS/MS spectra will be searched against the reduced MetaNovo-generated database (~21.2k sequences). More information about analysis using MaxQuant is available, including Label-free data analysis and MaxQuant and MSstats for the analysis of TMT data.
Hands On: Peptide discovery using MaxQuant
MaxQuant ( Galaxy version 2.0.3.0+galaxy0) with the following parameters:
In “Input Options”:
param-file“FASTA files”: output (Input dataset)
In “Search Options”:
param-file“Specify an experimental design template (if needed). For detailed instructions see the help text.”: output (Input dataset)
“minimum peptide length”: 8
“Match between runs”: Yes
“Maximum peptide length for unspecific searches”: 50
In “Protein quantification”:
“Use only unmodified peptides”: Yes
“Modifications used in protein quantification”: Oxidation (M)
In “LFQ Options”:
“iBAQ (calculates absolute protein abundances by normalizing to copy number and not protein mass)”: No
“Generate PTXQC (proteomics quality control pipeline) report? (experimental setting)”: False
In “Output Options”:
“Select the desired outputs.”: Protein Groupsmqpar.xmlPeptidesMSMSmsms scanssummaryMaxQuant and PTXQC logyaml config file
Question
What is the Experimental Design file for MaxQuant?
In MaxQuant, the Experimental Design file is used to specify the experimental conditions, sample groups, and the relationships between different samples in a proteomics experiment. This file is a crucial component of the MaxQuant analysis process because it helps the software correctly organize and analyze the mass spectrometry data. The Experimental Design file typically has a “.txt” extension and is a tab-delimited text file. Here’s what you might include in an Experimental Design file for MaxQuant: Sample Names (You specify the names of each sample in your experiment. These names should be consistent with the naming conventions used in your raw data files.), Experimental Conditions (You define the experimental conditions or treatment groups associated with each sample. For example, you might have control and treated groups, and you would assign the appropriate condition to each sample.), Replicates (You indicate the replicates for each sample, which is important for assessing the statistical significance of your results. Replicates are typically denoted by numeric values (e.g., “1,” “2,” “3”) or by unique identifiers (e.g., “Replicate A,” “Replicate B”)), Labels (If you’re using isobaric labeling methods like TMT (Tandem Mass Tag) or iTRAQ (Isobaric Tags for Relative and Absolute Quantitation), you specify the labels associated with each sample. This is important for quantification.), Other Metadata (You can include additional metadata relevant to your experiment, such as the biological source, time points, or any other information that helps describe the samples and experimental conditions.)
Using Text Manipulation Tools to Manage Microbial Outputs from MaxQuant
Hands On: Selecting microbial peptides from MaxQuant with Select
Select with the following parameters:
param-file“Select lines from”: peptides (output of MaxQuanttool)
“that”: NOT Matching
“the pattern”: (_HUMAN)|(_REVERSED)|(REV_)|(CON)|(con)
“Keep header line”: Yes
Hands On: Cutting out microbial peptide sequences with Cut
Cut with the following parameters:
“Cut columns”: c1
param-file“From”: out_file1 (output of Selecttool)
Hands On: Remove header line from MaxQuant peptide output with Remove beginning
Remove beginning with the following parameters:
param-file“from”: out_file1 (output of Cuttool)
Hands On: Grouping distinct (unique) peptide sequences from MaxQuant with Group
Group with the following parameters:
param-file“Select data”: out_file1 (output of Remove beginningtool)
“Group by column”: c1
Question
How case-sensitive is the Group tool? Can I only group by column values, and not row values?
You can make it case sensitive, by default it is not. The tool here does column grouping only.
Process SGPS and MaxQuant peptides to compile one list of unique microbial peptides
Hands On: Concatenate SGPS and MaxQuant peptides into a singular database with Concatenate datasets
Concatenate datasets ( Galaxy version 0.1.1) with the following parameters:
param-files“Datasets to concatenate”: out_file1 (output of Grouptool), out_file1 (output of Grouptool)
Hands On: Group the peptides from SGPS and MaxQuant to remove duplicates with Group
Group with the following parameters:
param-file“Select data”: out_file1 (output of Concatenate datasetstool)
“Group by column”: c1
Conclusion
By following this tutorial, you have effectively conducted a search of your MS/MS data against the compact database and successfully retrieved reliable microbial peptides. After identifying these microbial peptides with the assistance of MaxQuant and SearchGUI, the next step is to verify the presence of these peptides. This compiled list of unique peptides will serve as the input for PepQuery to validate the confident identification of microbial peptides with the help of the verification workflow.
You've Finished the Tutorial
Please also consider filling out the Feedback Form as well!
Key points
Employ SearchGUI/PeptideShaker and MaxQuant for database searching
Extraction of confident microbial peptides for verification
Frequently Asked Questions
Have questions about this tutorial? Have a look at the available FAQ pages and support channels
Further information, including links to documentation and original publications, regarding the tools, analysis techniques and the interpretation of results described in this tutorial can be found here.
Feedback
Did you use this material as an instructor? Feel free to give us feedback on how it went.
Did you use this material as a learner or student? Click the form below to leave feedback.
Hiltemann, Saskia, Rasche, Helena et al., 2023 Galaxy Training: A Powerful Framework for Teaching! PLOS Computational Biology 10.1371/journal.pcbi.1010752
Batut et al., 2018 Community-Driven Data Analysis Training for Biology Cell Systems 10.1016/j.cels.2018.05.012
@misc{proteomics-clinical-mp-2-discovery,
author = "Subina Mehta and Katherine Do and Dechen Bhuming",
	title = "Clinical Metaproteomics 2: Discovery (Galaxy Training Materials)",
	year = "",
	month = "",
	day = "",
	url = "\url{https://training.galaxyproject.org/training-material/topics/proteomics/tutorials/clinical-mp-2-discovery/tutorial.html}",
	note = "[Online; accessed TODAY]"
}
@article{Hiltemann_2023,
	doi = {10.1371/journal.pcbi.1010752},
	url = {https://doi.org/10.1371%2Fjournal.pcbi.1010752},
	year = 2023,
	month = {jan},
	publisher = {Public Library of Science ({PLoS})},
	volume = {19},
	number = {1},
	pages = {e1010752},
	author = {Saskia Hiltemann and Helena Rasche and Simon Gladman and Hans-Rudolf Hotz and Delphine Larivi{\`{e}}re and Daniel Blankenberg and Pratik D. Jagtap and Thomas Wollmann and Anthony Bretaudeau and Nadia Gou{\'{e}} and Timothy J. Griffin and Coline Royaux and Yvan Le Bras and Subina Mehta and Anna Syme and Frederik Coppens and Bert Droesbeke and Nicola Soranzo and Wendi Bacon and Fotis Psomopoulos and Crist{\'{o}}bal Gallardo-Alba and John Davis and Melanie Christine Föll and Matthias Fahrner and Maria A. Doyle and Beatriz Serrano-Solano and Anne Claire Fouilloux and Peter van Heusden and Wolfgang Maier and Dave Clements and Florian Heyl and Björn Grüning and B{\'{e}}r{\'{e}}nice Batut and},
	editor = {Francis Ouellette},
	title = {Galaxy Training: A powerful framework for teaching!},
	journal = {PLoS Comput Biol}
}
Congratulations on successfully completing this tutorial!
Do you want to extend your knowledge?
Follow one of our recommended follow-up trainings:
Questions: