Plotly
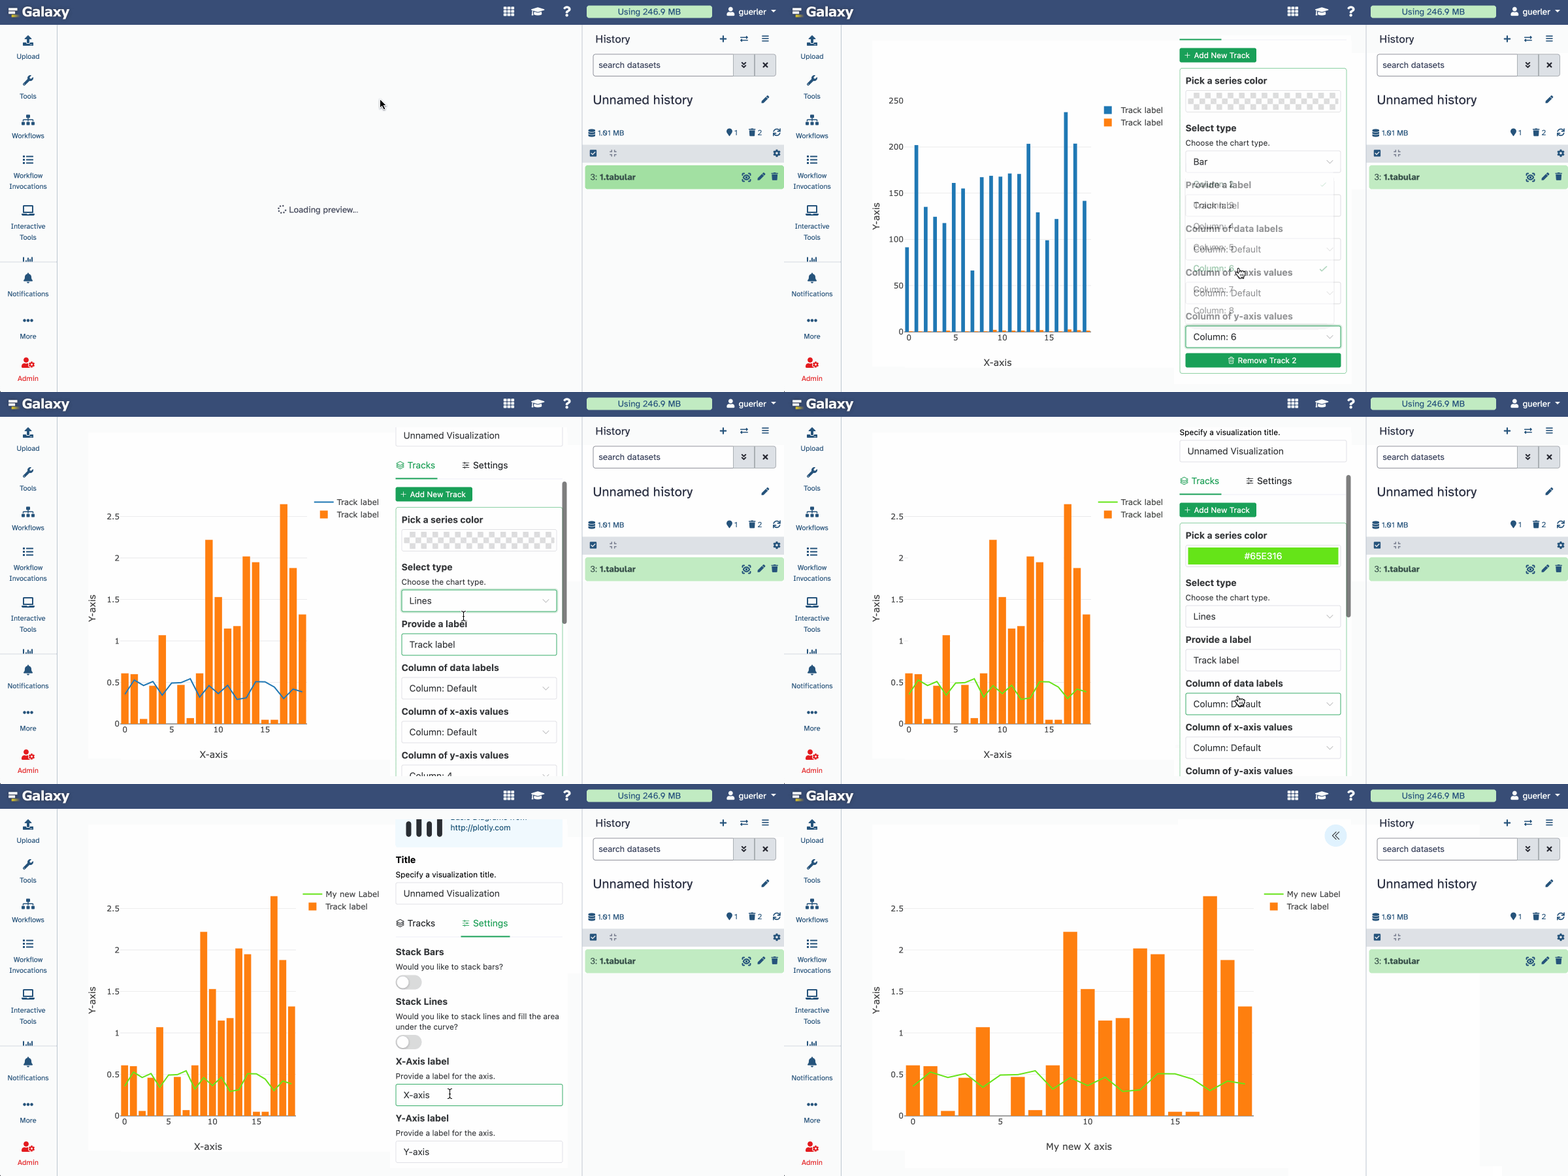
Plotly is a browser-based platform for creating interactive, high-quality visualizations. It supports a wide range of chart types, including scatter plots, line charts, bar charts and 3D plots. Users can manipulate data dynamically, zoom, pan, and filter in real time, with all interactions rendered directly in the browser. Plotly integrates with JavaScript, enabling fully interactive, web-native visualizations without a dedicated backend.
Learn more at: https://plotly.com/javascript/
Live Demo
Start using Plotly at: https://usegalaxy.org/visualizations/create/plotly

Source Code
View the code on GitHub:
https://github.com/galaxyproject/galaxy-visualizations/tree/main/packages/plotly