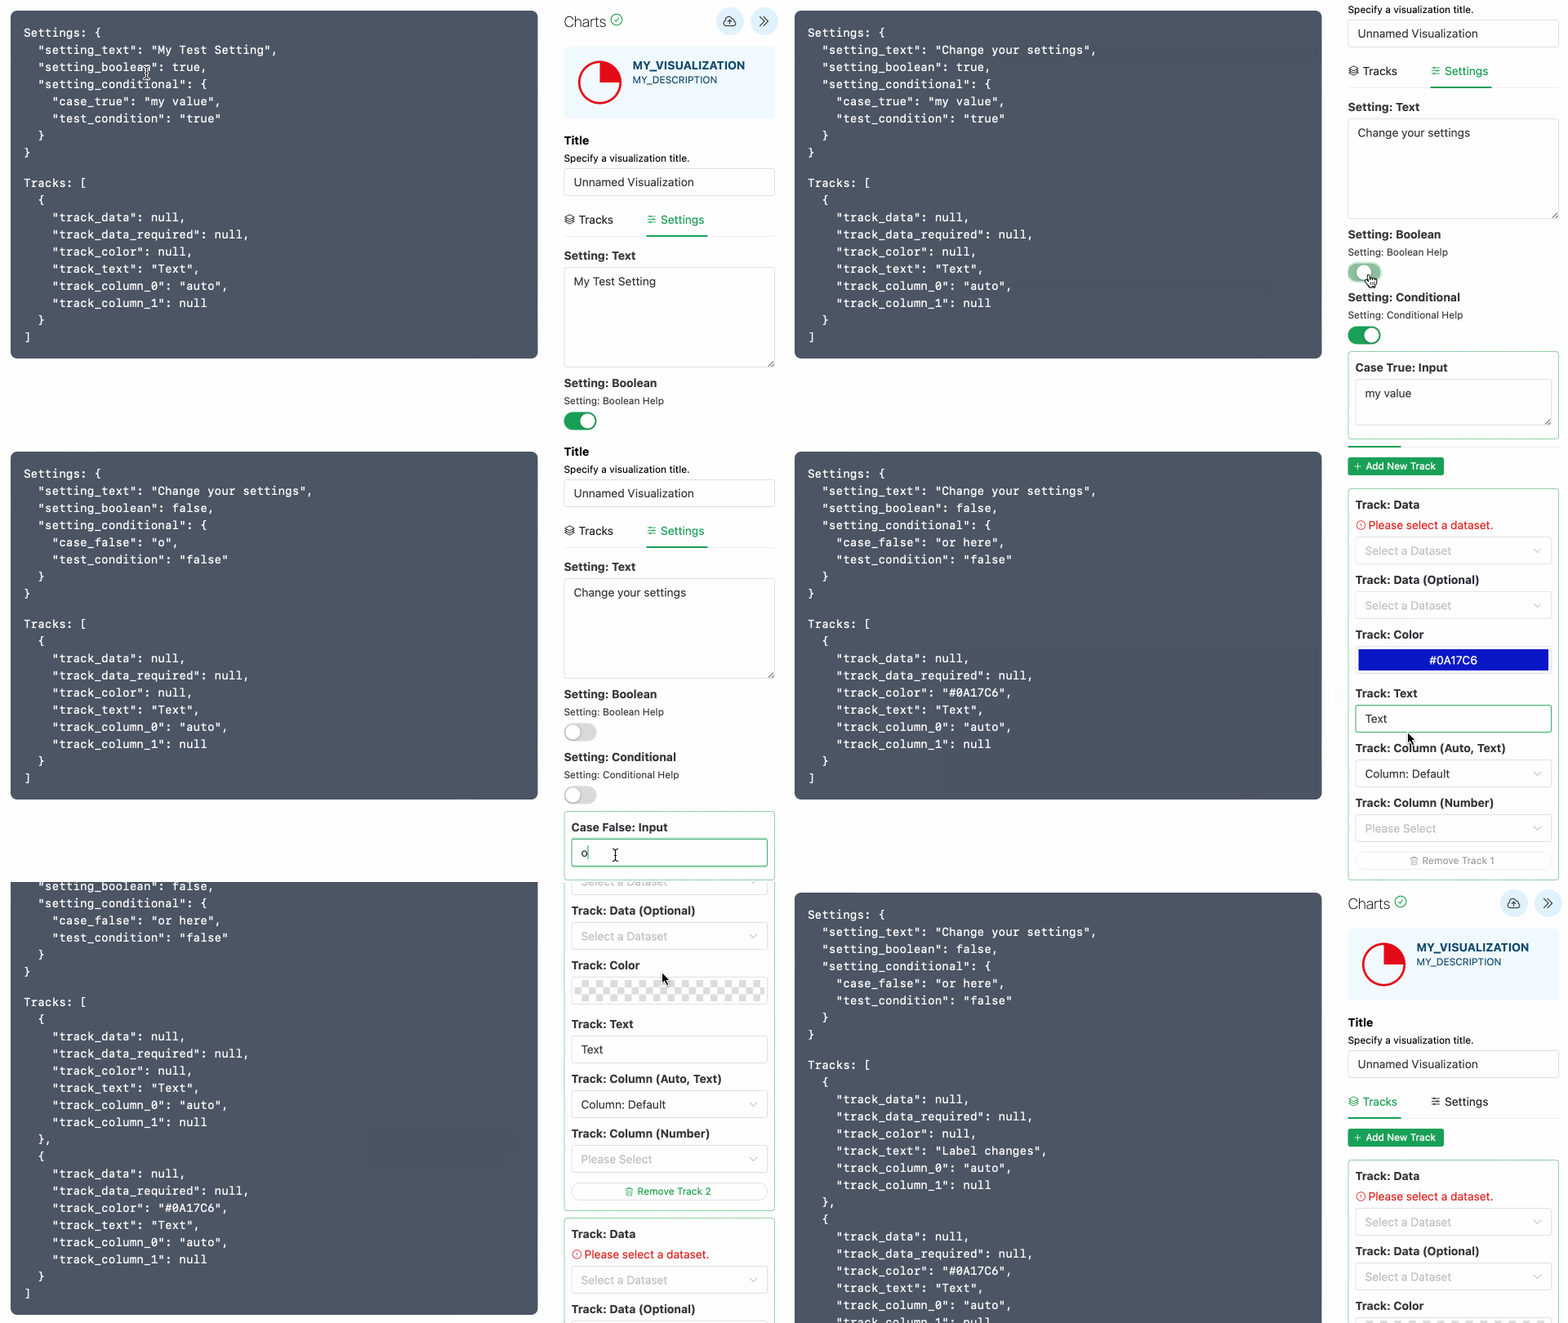
What is Galaxy Charts?
Galaxy Charts is the visualization plugin framework of the Galaxy platform. It provides the core infrastructure for developing and embedding visualizations using a simple and extensible plugin interface.
At its core, Galaxy Charts is framework-agnostic. Visualizations can be implemented with plain JavaScript or any frontend framework of your choice.
To support a modern and efficient development workflow, Galaxy Charts provides an optional development environment and tooling built with the following technologies:
Using this setup, you can develop Galaxy visualizations locally with hot-reloading, efficient bundling, and modern tooling. This environment is optional, but provides a streamlined and productive experience when building more complex visualizations.

Key Features
- Local and Remote Data Access: Load data locally or connect to a remote Galaxy instance to access data providers and resources through the Galaxy API.
- Automated Testing: Test your visualization thoroughly in the local environment before deploying it to Galaxy.
- Enhanced Development Workflow: Use modern tooling to reduce the time and effort needed to build or embed 3rd-party visualizations.
- Automated Form Rendering (Optional): An optional Vue-based UI package can dynamically generate configuration forms in a side panel for visualizations that define inputs.
In short, Galaxy Charts simplifies the process of developing and deploying visualizations on the Galaxy platform, while remaining flexible about how those visualizations are implemented.
Alternative JS-Agnostic Approach Without Built-In Form
If your visualization does not require form rendering, or if you prefer not to use Vue, consider following the lightweight Vite-only approach. Both approaches use Vite as the underlying build tool, but only one includes the optional Vue UI package.
This option is ideal for:
- Visualizations that don't require dynamic form inputs
- Developers who prefer working with vanilla JS, React, or other frameworks
- Simpler use cases where fast load times and minimal dependencies are key