Introduction to Image Analysis using Galaxy
| Author(s) |
|
| Reviewers |
|
OverviewQuestions:
Objectives:
How do I use Galaxy with imaging data?
How do I convert images using Galaxy?
How do I display images in Galaxy?
How do I filter images in Galaxy?
How do I segment simple images in Galaxy?
Requirements:
How to handle images in Galaxy.
How to perform basic image processing in Galaxy.
- Introduction to Galaxy Analyses
- tutorial Hands-on: FAIR Bioimage Metadata
- tutorial Hands-on: REMBI - Recommended Metadata for Biological Images – metadata guidelines for bioimaging data
Time estimation: 1 hourLevel: Introductory IntroductorySupporting Materials:Published: Aug 13, 2019Last modification: Jan 18, 2026License: Tutorial Content is licensed under Creative Commons Attribution 4.0 International License. The GTN Framework is licensed under MITpurl PURL: https://gxy.io/GTN:T00181rating Rating: 5.0 (0 recent ratings, 6 all time)version Revision: 18
Image analysis is the extraction of meaningful information from images by means of digital image processing techniques. Imaging is an important component in a wide range of scientific fields of study, such as astronomy, medicine, physics, biology, geography, chemistry, robotics, and industrial manufacturing.
This tutorial shows how to use Galaxy to perform basic image analysis tasks such as format conversion, image enhancement, segmentation, and feature extraction.
AgendaIn this tutorial, we will deal with:
Getting Data
The dataset required for this tutorial is available from Zenodo and contains a screen of DAPI stained HeLa nuclei (more information). We will use a sample image from this dataset for training basic image processing skills in Galaxy.
Our objective is to automatically count the number of cells contained in this image. In order to achieve this, we will enhance the quality of the image, automatically detect the nuclei and segment the nuclei and count them.
Hands On: Data upload
If you are logged in, create a new history for this tutorial
To create a new history simply click the new-history icon at the top of the history panel:
- Import the following dataset from Zenodo or from the data library (ask your instructor).
- Important: Choose the type of data as
zip.https://zenodo.org/record/3362976/files/B2.zip
- Copy the link location
Click galaxy-upload Upload at the top of the activity panel
- Select galaxy-wf-edit Paste/Fetch Data
Paste the link(s) into the text field
Press Start
- Close the window
As an alternative to uploading the data from a URL or your computer, the files may also have been made available from a shared data library:
- Go into Libraries (left panel)
- Navigate to the correct folder as indicated by your instructor.
- On most Galaxies tutorial data will be provided in a folder named GTN - Material –> Topic Name -> Tutorial Name.
- Select the desired files
- Click on Add to History galaxy-dropdown near the top and select as Datasets from the dropdown menu
In the pop-up window, choose
- “Select history”: the history you want to import the data to (or create a new one)
- Click on Import
- Unzip ( Galaxy version 6.0+galaxy0) with the following parameters:
- param-file “input_file”:
B2.zip- “Extract single file”:
Single file- “Filepath”:
B2--W00026--P00001--Z00000--T00000--dapi.tifRename galaxy-pencil the dataset to
input.tiff
- Click on the galaxy-pencil pencil icon for the dataset to edit its attributes
- In the central panel, change the Name field
- Click the Save button


Image Metadata Extraction
Now, we can extract metadata from an image.
Hands On: Extract Image Metadata
- Show image info ( Galaxy version 5.7.1+galaxy1) with the following parameters to extract metadata from the image:
- param-file “Input Image”:
input.tifffile (output of the previous step)Click on the galaxy-eye (eye) icon next to the file name, to look at the file content and search for image acquisition information
Question
- What is the datatype?
- What are the pixel dimentions?
- How many bits per pixel are used?
- TIFF
- 1344x1024
- 16
Visual Inspection of TIFF Images
Not all tools can handle all image formats. Especially proprietary microscope image formats should be converted to TIFF (supported formats). However, TIFF cannot be displayed in most web browsers directly. Therefore, for visual inspection of TIFF images, we use a TIFF visualization plugin in Galaxy.
Hands On: Visual Inspection of TIFF Images
- Click on the title of your file to see the row of small icons for saving, linking, etc.:
- Click on the visualise icon galaxy-visualise and then select the Tiff Viewer visualization plugin.
Your image should look something like this:

QuestionYou can observe that the image content is barely visible. Why?
The original image is 16-bit and the intensity values of the image (33069 to 36863) are spread over a very small fraction (only about 6%) of the intensity values that can be represented using 16 bits (0 to 65535, where 0 corresponds to black and 65535 corresponds to white). Therefore, for improved visibility the intensity histogram of the image should be normalized first.
Next we will normalize the histogram to improve the contrast. We do this using a Contrast Limited Adaptive Histogram Equalization (CLAHE) approach.
Hands On: Normalize Histogram
- Perform histogram equalization ( Galaxy version 0.18.1+galaxy0) with the following parameters to normalize the histogram of the image:
- param-file “Input image”:
input.tifffile- “Histogram equalization algorithm”:
CLAHE- Rename galaxy-pencil the generated file to
input_normalized.- Click on the visualise icon galaxy-visualise of the file to visually inspect the image using the Tiff Viewer visualization plugin.
Your image should now look something like this:
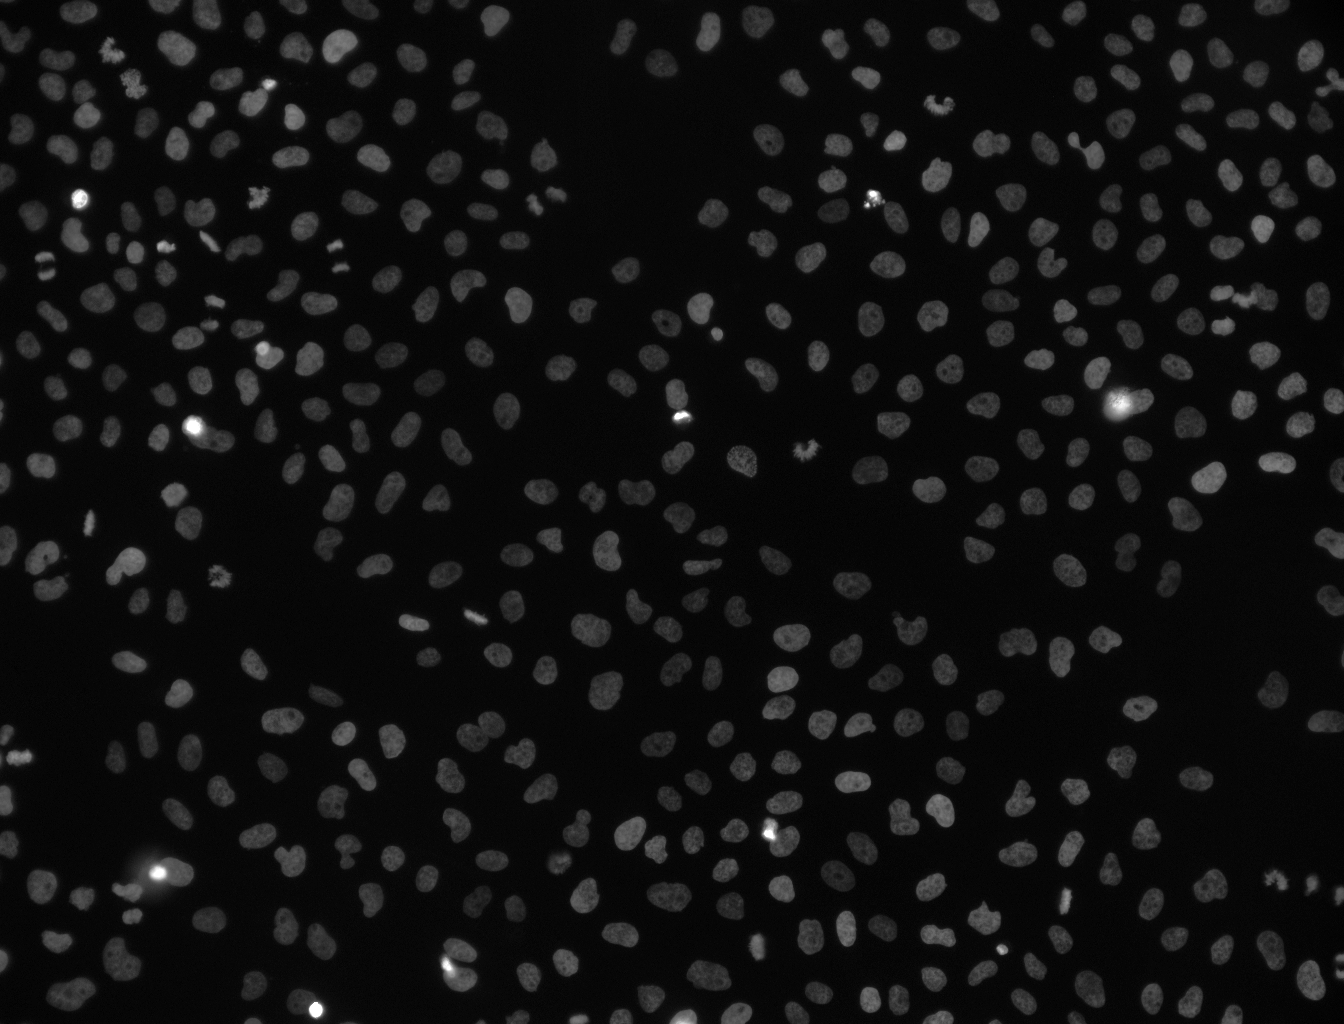
We can now clearly make out the presence of the stained nuclei. Next we will automatically detect these features and segment the image.
Image Filtering
Specific features of interest (e.g., edges, noise) can be enhanced or suppressed by using an image filter.
Hands On: Filter image
- Filter 2-D image ( Galaxy version 1.12.0+galaxy1) with the following parameters to smooth the image:
- “Filter type”:
Gaussian- “Sigma”:
3- param-file “Source file”:
input.tifffile- Rename galaxy-pencil the generated file to
input_smoothed.- Perform histogram equalization ( Galaxy version 0.18.1+galaxy0) with the following parameters to normalize the histogram of the image:
- param-file “Input image”:
input_smoothedfile (output of Filter 2-D image ( Galaxy version 1.12.0+galaxy1))- “Histogram equalization algorithm”:
CLAHE- Rename galaxy-pencil the generated file to
input_smoothed_normalized.- Click on the visualise icon galaxy-visualise of the file to visually inspect the image and compare the result with
input_normalized. You can observe thatinput_smoothed_normalizedhas significantly reduced noise.
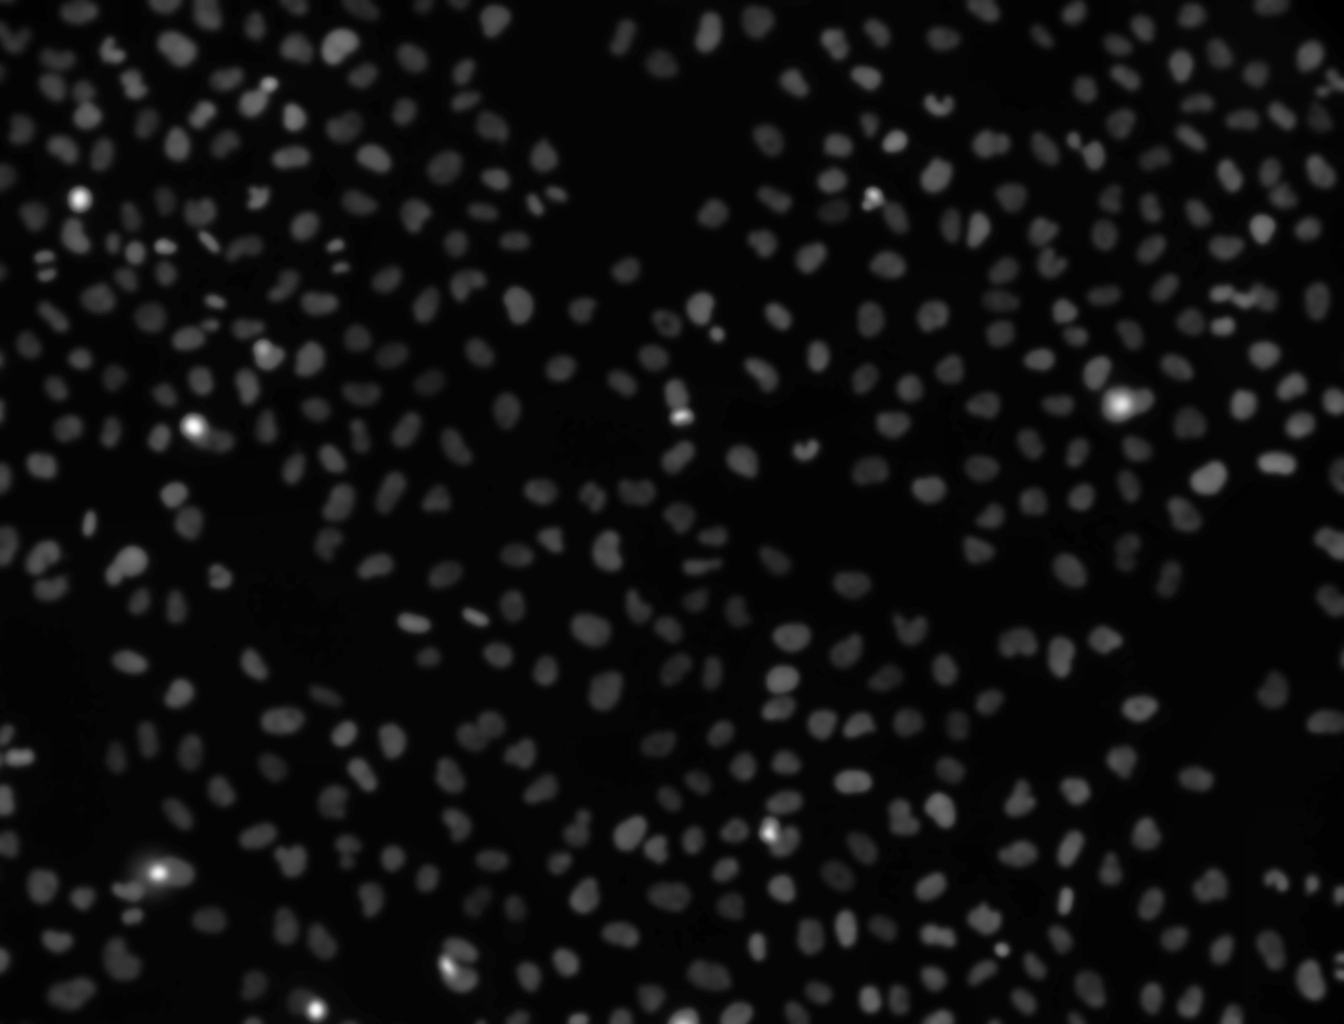
Your image should now look something like this:
Segmentation
Objects of interest like nuclei can be segmented by using a smoothed image and thresholding. Moreover, the results can be overlayed with the original image.
Hands On: Segment image
- Threshold image ( Galaxy version 0.18.1+galaxy3) with the following parameters to segment the image:
- param-file “Input image”:
input_smoothedfile (output of Filter 2-D image ( Galaxy version 1.12.0+galaxy1))- “Thresholding method”:
Globally adaptive / Otsu- Rename galaxy-pencil the generated file to
input_segmented.- Convert binary image to label map ( Galaxy version 0.5+galaxy0) with the following parameters to segment the image:
- param-file “Binary image”:
input_segmentedfile (output of Threshold image ( Galaxy version 0.18.1+galaxy3))Rename galaxy-pencil the generated file to
input_segmented_labeledQuestion
- What does Convert binary image to label map ( Galaxy version 0.5+galaxy0) do? (Hint: check the tool help section)
- View the
input_segmented_labeledimage from the last step, what do you see? Can you explain this result?- Exercise: Try to make the information in this image better visible (Hint: use Perform histogram equalization ( Galaxy version 0.18.1+galaxy0))
- The tool assigns each connected component (e.g., segmented cell) in the image a unique object ID called label and stores it as the intensity value.
- The image looks completely black. The object labels generated by Convert binary image to label map ( Galaxy version 0.5+galaxy0) are relatively low. Since the labels are stored as intensity values, these are too low to be visible in this case. Nevertheless, there is more information in this image than meets the eye.
- To make the labeled objects visible, the values have to be stretched to a larger range of visible intensity values. We can do that by equalizing the histogram again. To this end, use Perform histogram equalization ( Galaxy version 0.18.1+galaxy0) with the following parameters to normalize the intensity values:
- param-file “Input image”:
input_segmented_labeledfile (output of Convert binary image to label map ( Galaxy version 0.5+galaxy0))- “Histogram equalization algorithm”:
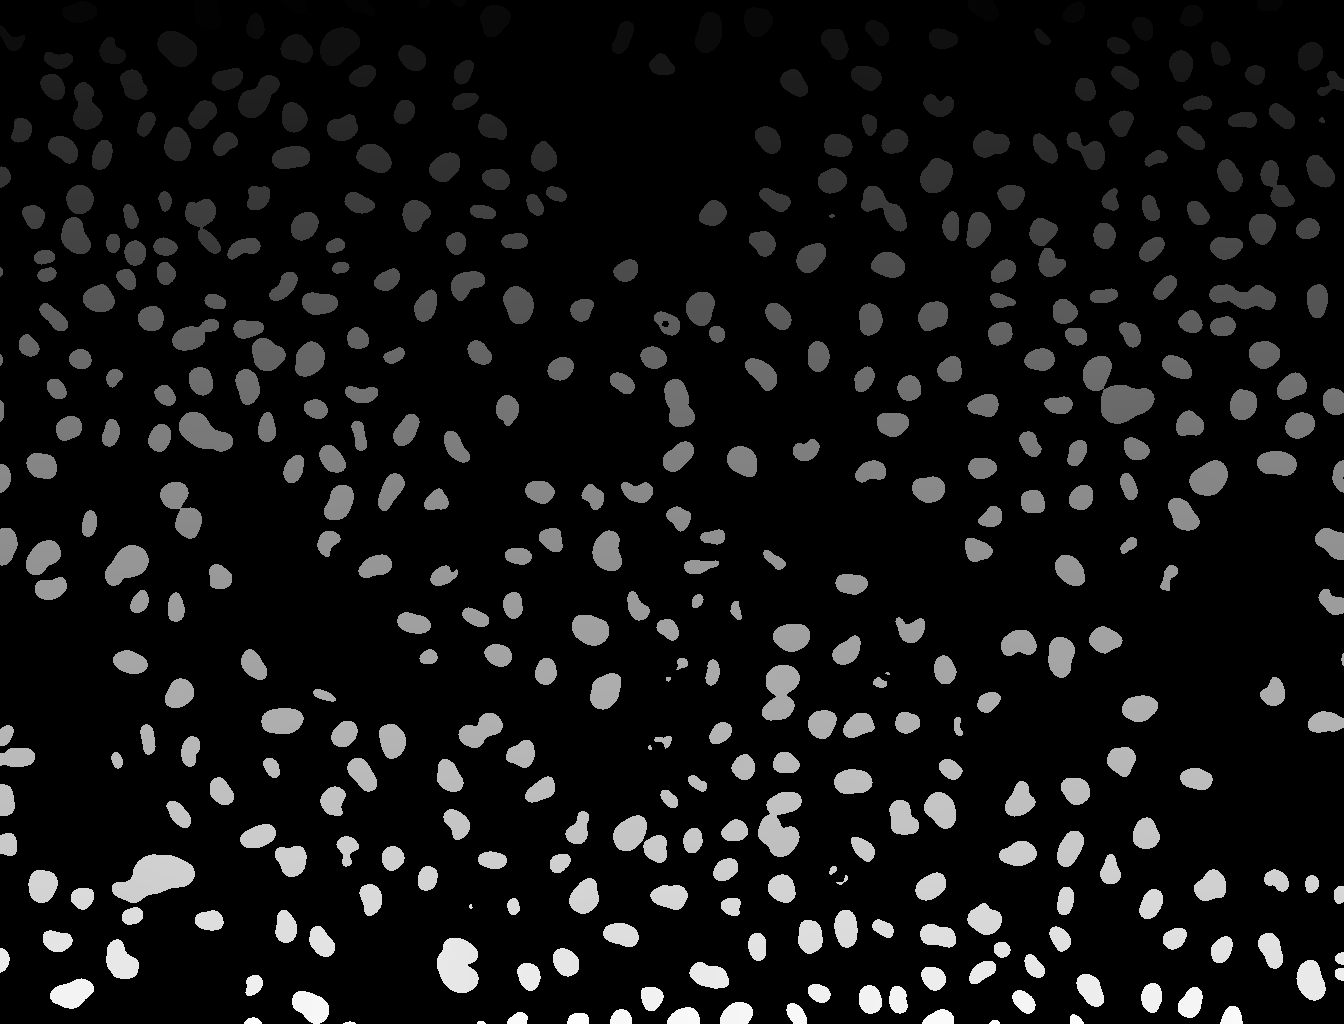
CLAHEThe information contained in the original image has now become visible to the human eye:
- Overlay images ( Galaxy version 0.0.4+galaxy4) with the following parameters to convert the image to PNG:
- “Type of the overlay”:
Segmentation contours over image- param-file “Intensity image”:
input_normalizedfile- param-file “Label map”:
input_segmented_labeledfile (output of Convert binary image to label map ( Galaxy version 0.5+galaxy0))- “Contour thickness”:
2- “Contour color”:
red- “Show labels”:
yes- “Label color”:
yellow- Click on the galaxy-eye (eye) icon next to the file name, to look at the file content and assess the segmentation performance.
- Count objects in label map ( Galaxy version 0.0.5-2) with the following parameters to count the segmented objects in the image:
- param-file “Source file”:
input_segmented_labeledfile (output of Convert binary image to label map ( Galaxy version 0.5+galaxy0))QuestionHow many objects were segmented?
The Count objects in label map ( Galaxy version 0.0.5-2) tool counted 425 objects.
The resulting image should look something like this:
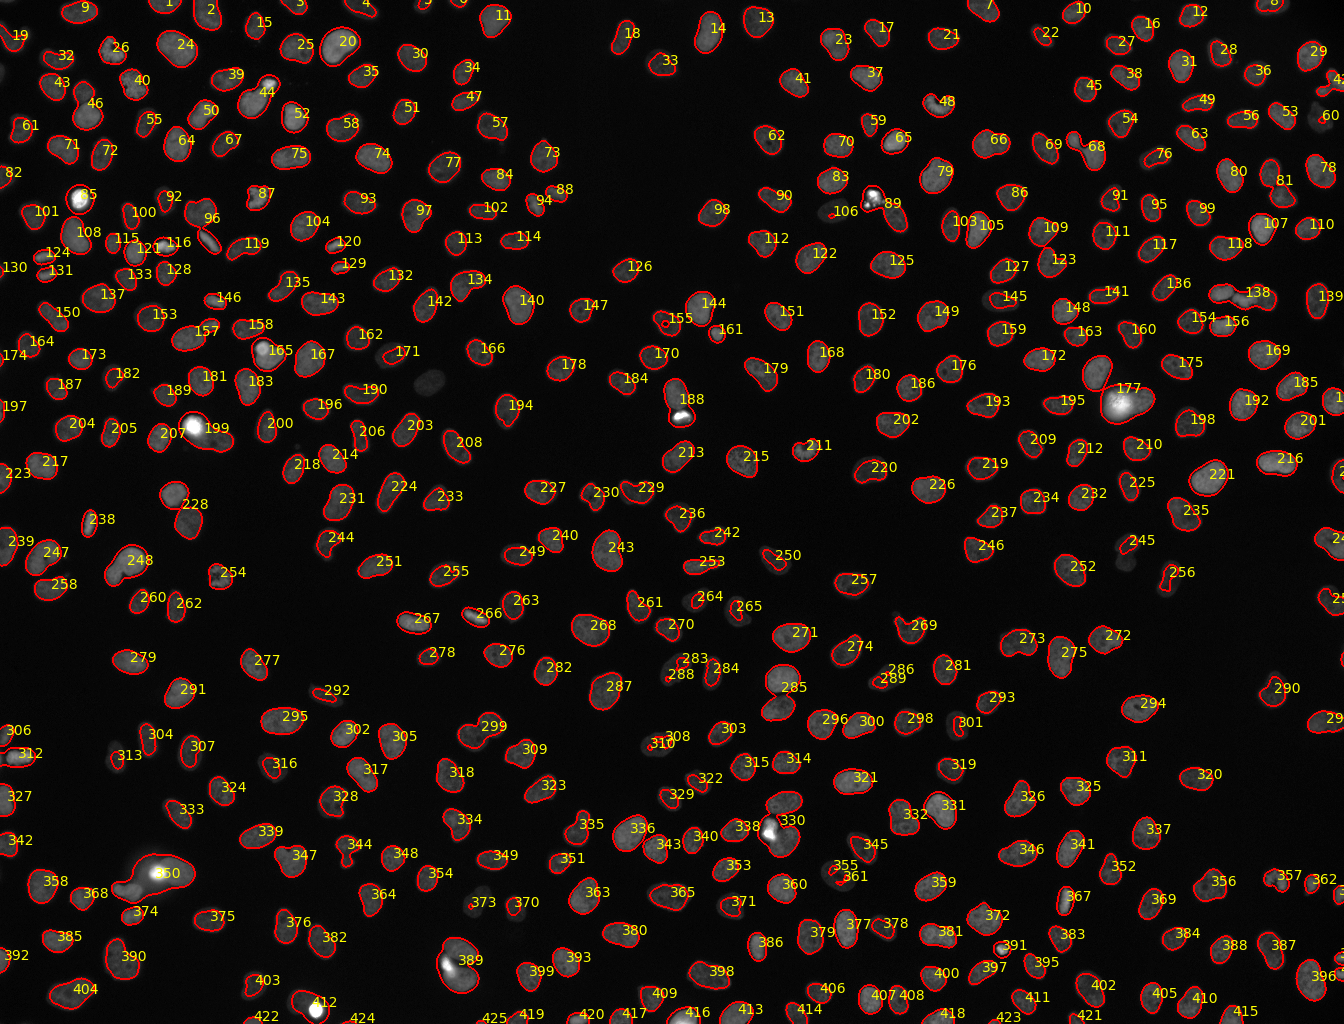
We see the segmentation mask overlayed; each detected object (nucleus) is labeled with its ID value.
We see that with the help of just a few simple steps, we were able to detect the locations of the stained nuclei, and count them.
Conclusion
In this exercise you imported images into Galaxy, extracted meta information from an image, learned how to visualize microscopy images, filtered the image, and segmented cells using Galaxy.
You've Finished the Tutorial
Key points
The Image Info tool can provide valuable metadata information of an image.
TIFF files cannot viewed directly in most web browser, so a visualization plugin must be used.
For visualization, images with a bit-depth more than 8-bit have to be histogram equalized.
Frequently Asked Questions
Have questions about this tutorial? Have a look at the available FAQ pages and support channelsUseful literature
Further information, including links to documentation and original publications, regarding the tools, analysis techniques and the interpretation of results described in this tutorial can be found here.
Feedback
Did you use this material as an instructor? Feel free to give us feedback on how it went.
Did you use this material as a learner or student? Click the form below to leave feedback.

Citing this Tutorial
- Thomas Wollmann, Saskia Hiltemann, Leonid Kostrykin, Introduction to Image Analysis using Galaxy (Galaxy Training Materials). https://training.galaxyproject.org/training-material/topics/imaging/tutorials/imaging-introduction/tutorial.html Online; accessed TODAY
- Hiltemann, Saskia, Rasche, Helena et al., 2023 Galaxy Training: A Powerful Framework for Teaching! PLOS Computational Biology 10.1371/journal.pcbi.1010752
- Batut et al., 2018 Community-Driven Data Analysis Training for Biology Cell Systems 10.1016/j.cels.2018.05.012
@misc{imaging-imaging-introduction,
author = "Thomas Wollmann and Saskia Hiltemann and Leonid Kostrykin",
	title = "Introduction to Image Analysis using Galaxy (Galaxy Training Materials)",
	year = "",
	month = "",
	day = "",
	url = "\url{https://training.galaxyproject.org/training-material/topics/imaging/tutorials/imaging-introduction/tutorial.html}",
	note = "[Online; accessed TODAY]"
}
@article{Hiltemann_2023,
	doi = {10.1371/journal.pcbi.1010752},
	url = {https://doi.org/10.1371%2Fjournal.pcbi.1010752},
	year = 2023,
	month = {jan},
	publisher = {Public Library of Science ({PLoS})},
	volume = {19},
	number = {1},
	pages = {e1010752},
	author = {Saskia Hiltemann and Helena Rasche and Simon Gladman and Hans-Rudolf Hotz and Delphine Larivi{\`{e}}re and Daniel Blankenberg and Pratik D. Jagtap and Thomas Wollmann and Anthony Bretaudeau and Nadia Gou{\'{e}} and Timothy J. Griffin and Coline Royaux and Yvan Le Bras and Subina Mehta and Anna Syme and Frederik Coppens and Bert Droesbeke and Nicola Soranzo and Wendi Bacon and Fotis Psomopoulos and Crist{\'{o}}bal Gallardo-Alba and John Davis and Melanie Christine Föll and Matthias Fahrner and Maria A. Doyle and Beatriz Serrano-Solano and Anne Claire Fouilloux and Peter van Heusden and Wolfgang Maier and Dave Clements and Florian Heyl and Björn Grüning and B{\'{e}}r{\'{e}}nice Batut and},
	editor = {Francis Ouellette},
	title = {Galaxy Training: A powerful framework for teaching!},
	journal = {PLoS Comput Biol}
}
Funding
These individuals or organisations provided funding support for the development of this resource
Congratulations on successfully completing this tutorial!
Do you want to extend your knowledge?Follow one of our recommended follow-up trainings:
You can use Ephemeris's
shed-tools installcommand to install the tools used in this tutorial.shed-tools install [-g GALAXY] [-a API_KEY] -t <(curl https://training.galaxyproject.org/training-material/api/topics/imaging/tutorials/imaging-introduction/tutorial.json | jq .admin_install_yaml -r)Alternatively you can copy and paste the following YAML
---
install_tool_dependencies: true
install_repository_dependencies: true
install_resolver_dependencies: true
tools:
- name: 2d_auto_threshold
  owner: imgteam
  revisions: 699a5e9146b3
  tool_panel_section_label: Imaging
  tool_shed_url: https://toolshed.g2.bx.psu.edu/
- name: 2d_histogram_equalization
  owner: imgteam
  revisions: b1c2c210813c
  tool_panel_section_label: Imaging
  tool_shed_url: https://toolshed.g2.bx.psu.edu/
- name: 2d_simple_filter
  owner: imgteam
  revisions: d51310ab328a
  tool_panel_section_label: Imaging
  tool_shed_url: https://toolshed.g2.bx.psu.edu/
- name: binary2labelimage
  owner: imgteam
  revisions: 984358e43242
  tool_panel_section_label: Imaging
  tool_shed_url: https://toolshed.g2.bx.psu.edu/
- name: count_objects
  owner: imgteam
  revisions: b58447a2eed2
  tool_panel_section_label: Imaging
  tool_shed_url: https://toolshed.g2.bx.psu.edu/
- name: image_info
  owner: imgteam
  revisions: f8b4eada923c
  tool_panel_section_label: Imaging
  tool_shed_url: https://toolshed.g2.bx.psu.edu/
- name: overlay_images
  owner: imgteam
  revisions: ca362a9bfa20
  tool_panel_section_label: Imaging
  tool_shed_url: https://toolshed.g2.bx.psu.edu/
- name: unzip
  owner: imgteam
  revisions: 57f0914ddb7b
  tool_panel_section_label: Collection Operations
  tool_shed_url: https://toolshed.g2.bx.psu.edu/