Analyse HeLa fluorescence siRNA screen
| Author(s) |
|
| Reviewers |
|
OverviewQuestions:
Objectives:
How do I analyze a HeLa fluorescence siRNA screen?
How do I segment cell nuclei?
How do I extract features from segmentations?
How do I filter segmentations by morphological features?
How do I apply a feature extraction workflow to a screen?
How do I visualize feature extraction results?
Requirements:
How to segment cell nuclei in Galaxy.
How to extract features from segmentations in Galaxy.
How to filter segmentations by morphological features in Galaxy.
How to extract features from an imaging screen in Galaxy.
How to analyse extracted features from an imaging screen in Galaxy.
- Introduction to Galaxy Analyses
- tutorial Hands-on: FAIR Bioimage Metadata
- tutorial Hands-on: REMBI - Recommended Metadata for Biological Images – metadata guidelines for bioimaging data
- tutorial Hands-on: Introduction to Image Analysis using Galaxy
Time estimation: 1 hourLevel: Intermediate IntermediateSupporting Materials:Published: Aug 13, 2019Last modification: Jan 18, 2026License: Tutorial Content is licensed under Creative Commons Attribution 4.0 International License. The GTN Framework is licensed under MITpurl PURL: https://gxy.io/GTN:T00180rating Rating: 5.0 (0 recent ratings, 3 all time)version Revision: 16
This tutorial shows how to segment and extract features from cell nuclei Galaxy for image analysis. As example use case, this tutorial shows you how to compare the phenotypes of PLK1 threated cells in comparison to a control. The data used in this tutorial is available at Zenodo.
RNA interference (RNAi) is used in the example use case for silencing genes by way of mRNA degradation. Gene knockdown by this method is achieved by introducing small double-stranded interfering RNAs (siRNA) into the cytoplasm. Small interfering RNAs can originate from inside the cell or can be exogenously introduced into the cell. Once introduced into the cell, exogenous siRNAs are processed by the RNA-induced silencing complex (RISC).The siRNA is complementary to the target mRNA to be silenced, and the RISC uses the siRNA as a template for locating the target mRNA. After the RISC localizes to the target mRNA, the RNA is cleaved by a ribonuclease. RNAi is widely used as a laboratory technique for genetic functional analysis. RNAi in organisms such as C. elegans and Drosophila melanogaster provides a quick and inexpensive means of investigating gene function. Insights gained from experimental RNAi use may be useful in identifying potential therapeutic targets, drug development, or other applications. RNA interference is a very useful research tool, allowing investigators to carry out large genetic screens in an effort to identify targets for further research related to a particular pathway, drug, or phenotype.
The example used in this tutorial deals with PLK1 knocked down cells. PLK1 is an early trigger for G2/M transition. PLK1 supports the functional maturation of the centrosome in late G2/early prophase and establishment of the bipolar spindle. PLK1 is being studied as a target for cancer drugs. Many colon and lung cancers are caused by K-RAS mutations. These cancers are dependent on PLK1.
AgendaIn this tutorial, we will deal with:
Getting data
The dataset required for this tutorial contains a screen of DAPI stained HeLa nuclei (more information). We will use a sample image from this dataset for training basic image processing skills in Galaxy.
Hands On: Data upload
If you are logged in, create a new history for this tutorial
To create a new history simply click the new-history icon at the top of the history panel:
- Import galaxy-upload the following dataset from Zenodo or from the data library (ask your instructor).
- Important: Choose the type of data as
zip.https://zenodo.org/record/3362976/files/B2.zip
- Copy the link location
Click galaxy-upload Upload at the top of the activity panel
- Select galaxy-wf-edit Paste/Fetch Data
Paste the link(s) into the text field
Press Start
- Close the window
As an alternative to uploading the data from a URL or your computer, the files may also have been made available from a shared data library:
- Go into Libraries (left panel)
- Navigate to the correct folder as indicated by your instructor.
- On most Galaxies tutorial data will be provided in a folder named GTN - Material –> Topic Name -> Tutorial Name.
- Select the desired files
- Click on Add to History galaxy-dropdown near the top and select as Datasets from the dropdown menu
In the pop-up window, choose
- “Select history”: the history you want to import the data to (or create a new one)
- Click on Import
- Unzip ( Galaxy version 6.0+galaxy0) with the following parameters:
- param-file “input_file”:
B2.zip- “Extract single file”:
Single file- “Filepath”:
B2--W00026--P00001--Z00000--T00000--dapi.tifRename galaxy-pencil the dataset to
testinput.tiff
- Click on the galaxy-pencil pencil icon for the dataset to edit its attributes
- In the central panel, change the Name field
- Click the Save button
- Unzip ( Galaxy version 6.0+galaxy0) with the following parameters:
- param-file “input_file”:
B2.zip- “Extract single file”:
All filesRename galaxy-pencil the resulting collection to
control
- Click on the collection
- Click on the name of the collection at the top
- Change the name
- Press Enter
- Import galaxy-upload the following dataset from Zenodo or from the data library (ask your instructor).
- Important: Choose the type of data as
zip.https://zenodo.org/record/3362976/files/B3.zip
- Copy the link location
Click galaxy-upload Upload at the top of the activity panel
- Select galaxy-wf-edit Paste/Fetch Data
Paste the link(s) into the text field
Press Start
- Close the window
As an alternative to uploading the data from a URL or your computer, the files may also have been made available from a shared data library:
- Go into Libraries (left panel)
- Navigate to the correct folder as indicated by your instructor.
- On most Galaxies tutorial data will be provided in a folder named GTN - Material –> Topic Name -> Tutorial Name.
- Select the desired files
- Click on Add to History galaxy-dropdown near the top and select as Datasets from the dropdown menu
In the pop-up window, choose
- “Select history”: the history you want to import the data to (or create a new one)
- Click on Import
- Unzip ( Galaxy version 6.0+galaxy0) to extract the zipped screen:
- param-file “input_file”:
B3.zip- “Extract single file”:
All files- Rename galaxy-pencil the collection to
PLK1- Upload galaxy-upload the following segmentation filter rules as a new pasted file (format:
tabular):area eccentricity min 500 0. max 100000 0.5
- Click galaxy-upload Upload Data at the top of the tool panel
- Select galaxy-wf-edit Paste/Fetch Data at the bottom
- Paste the file contents into the text field
- Change Type from “Auto-detect” to
tabular* Press Start and Close the windowRename galaxy-pencil dataset to
rules
- Click on the galaxy-pencil pencil icon for the dataset to edit its attributes
- In the central panel, change the Name field
- Click the Save button


Create feature extraction workflow
First, we will create and test a workflow which extracts mean DAPI intensity, area, and major axis length of cell nuclei from an image.
Hands On: Create feature extraction workflow
- Filter 2-D image ( Galaxy version 1.12.0+galaxy1) with the following parameters to smooth the image:
- param-file “Input image”:
testinput.tifffile- “Filter type”:
Gaussian- “Sigma”:
3- Threshold image ( Galaxy version 0.18.1+galaxy3) with the following parameters to segment the image:
- param-file “Input image”: output of Filter 2-D image ( Galaxy version 1.12.0+galaxy1)
- “Thresholding method”:
Globally adaptive / Otsu- Convert binary image to label map ( Galaxy version 0.5+galaxy0) with the following parameters to split touching objects:
- param-file “Binary image”: output of Threshold image ( Galaxy version 0.18.1+galaxy3)
- “Mode”:
Watershed transform- “Minimum distance between two objects”:
20- Extract image features ( Galaxy version 0.18.1+galaxy0) with the following parameters to extract features from the segmented objects:
- param-file “Label map”: output of Convert binary image to label map ( Galaxy version 0.5+galaxy0)
- “Use the intensity image to compute additional features”:
No intensity image- “Select features to compute”:
Select features- “Available features”:
- param-check
Label from the label map- param-check
Area- param-check
Eccentricity- param-check
Major axis length- Filter label map by rules ( Galaxy version 0.0.1-4) with the following parameters to filter the label map from 3. with the extracted features and a set of rules:
- param-file “Label map”: output of Convert binary image to label map ( Galaxy version 0.5+galaxy0)
- param-file “Features”: output of Extract image features ( Galaxy version 0.18.1+galaxy0)
- param-file “Rules”:
rulesfile- Extract image features ( Galaxy version 0.18.1+galaxy0) with the following parameters to extract features the final readout from the segmented objects:
- param-file “Label map”: output of Filter label map by rules ( Galaxy version 0.0.1-4)
- “Use the intensity image to compute additional features”:
Use intensity image- param-file “Intensity image”:
testinput.tifffile- “Select features to compute”:
Select features- “Available features”:
- param-check
Mean Intensity (requires original image)- param-check
Area- param-check
Major axis length- Now we can extract the workflow for batch processing:
- Name it “feature_extraction”.
- Don’t treat
B2.zipandB3.zipas inputs (the workflow is supposed to be applied to the images directly).- Exclude Unzip ( Galaxy version 6.0+galaxy0) by unchecking the tool (3 times).
Clean up your history: remove any failed (red) jobs from your history by clicking on the galaxy-delete button.
This will make the creation of the workflow easier.
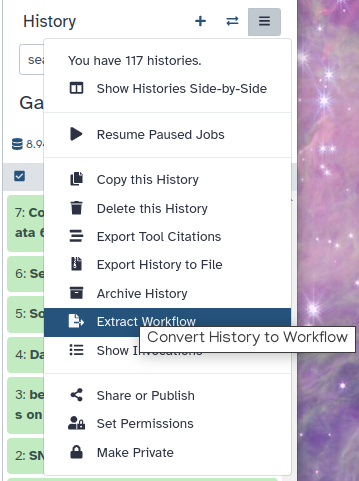
Click on galaxy-gear (History options) at the top of your history panel and select Extract workflow.
The central panel will show the content of the history in reverse order (oldest on top), and you will be able to choose which steps to include in the workflow.
Replace the Workflow name to something more descriptive.
Rename each workflow input in the boxes at the top of the second column.
If there are any steps that shouldn’t be included in the workflow, you can uncheck them in the first column of boxes.
Click on the Create Workflow button near the top.
You will get a message that the workflow was created.
- Edit the workflow you just created:
- Select “Input dataset” from the list of tools. The step param-file 8: Input Dataset appears.
- Change the “Label” of param-file 8: Input Dataset to
input image.- Change the “Label” of param-file 1: rules to
filter rules.- Connect the output of param-file 8: input image to the input of tool 2: Filter 2-D image.
- Connect the output of param-file 8: input image to the “Intensity image” input of tool 7: Extract image features.
- Mark the results of tool 6: Filter label map by rules and tool 7: Extract image features as the primary outputs of the workflow (by clicking on the checkboxes of the outputs).
The resulting workflow should look something like this:
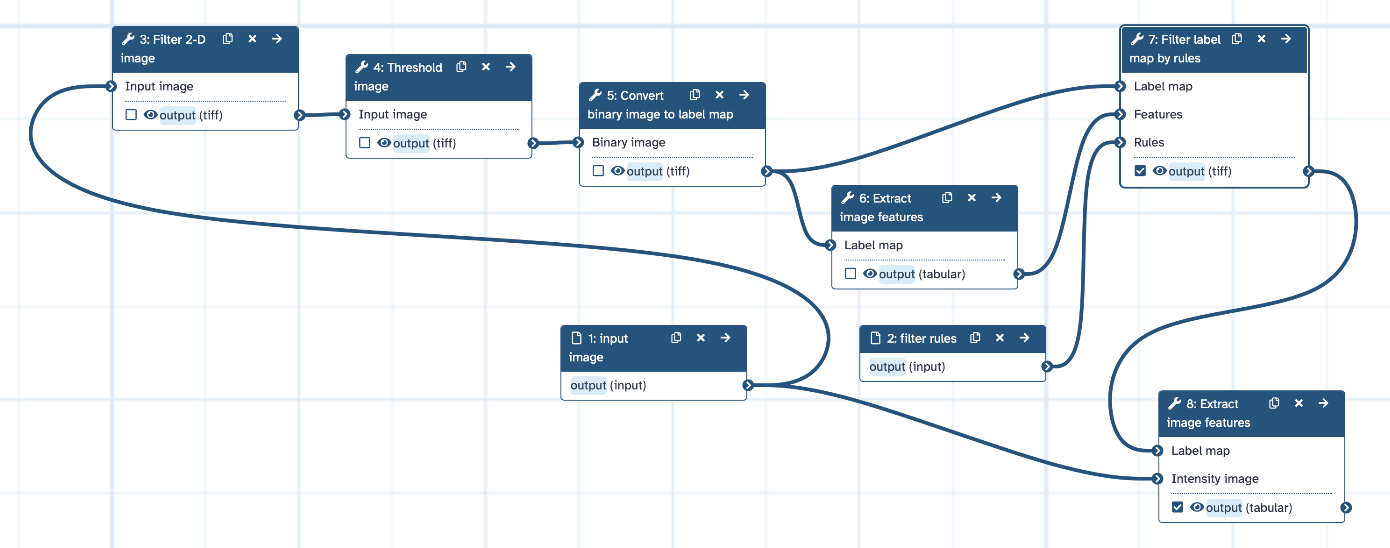 Open image in new tab
Apply workflow to screen
Now we want to apply our extracted workflow to a series of images and merge the results. For this purpose, we create a workflow which uses the previously created workflow as a sub-workflow.
Hands On: Create screen analysis workflow
Create a new workflow in the workflow editor.
- Click Workflow on the top bar
- Click the new workflow galaxy-wf-new button
- Give it a clear and memorable name
- Clicking Save will take you directly into the workflow editor for that workflow
- Need more help? Please see the How to make a workflow subsection here
- Select “Input dataset collection” from the list of tools. The step param-collection 1: Input Dataset Collection appears in your workflow. Change the “Label” of this step to
input images.- Add the input dataset param-file 2: rules to your workflow (select “Input dataset” from the list of tools and set the “Label” of the newly created step to
rules).- Add the workflow feature_extraction workflow as a sub-workflow:
- Expand the “Workflows” section in the list of tools and select “feature_extraction” to add it to the workflow.
- Connect the output of param-file 1: input images to the “input image” input of workflow 3: feature_extraction.
- Connect the output of param-file 2: rules to the “filter rules” input of workflow 3: feature_extraction.
- Create the step tool 4: Collapse Collection in the workflow (by choosing “Collapse Collection” from the list of tools).
- Connect the output “output (tabular)” of workflow 3: feature_extraction to tool 4: Collapse Collection.
- Set “Keep one header line” of tool 4: Collapse Collection:
Yes- Set “Prepend File name” of tool 4: Collapse Collection:
No- Mark the output of tool 4: Collapse Collection as the primary workflow output.
- Save your workflow and name it
analyze_screen.
The resulting workflow should look something like this:
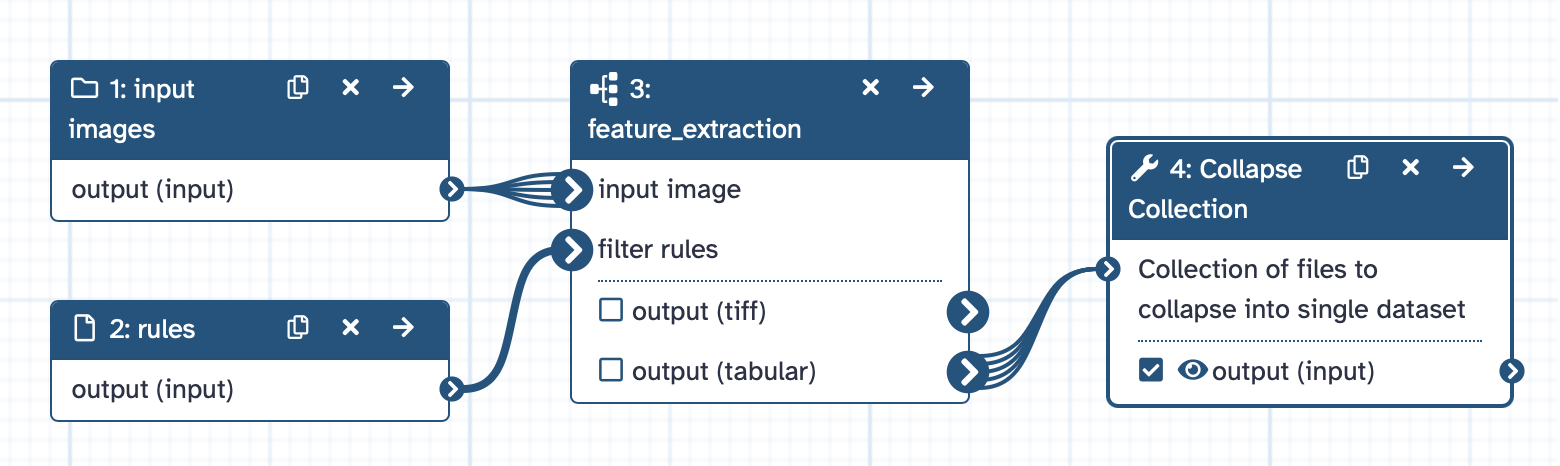 Open image in new tab
Hands On: Run screen analysis workflow
Run the “analyze_screen” workflow on the
controlscreen using therulesfile.
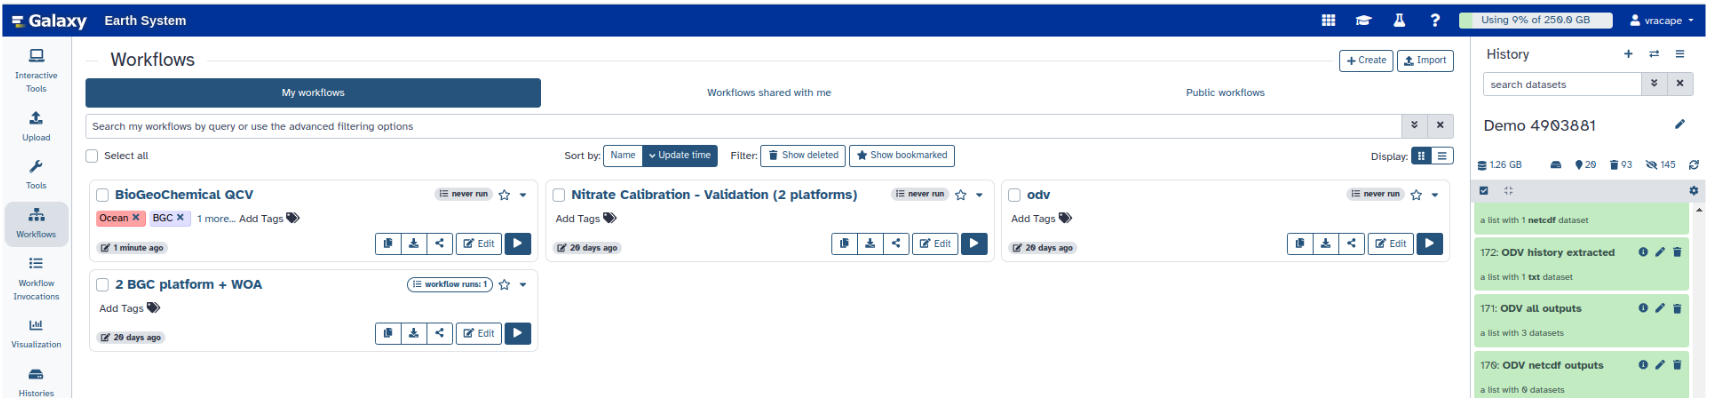
- Click on Workflows on the Activity Bar on the left.
- At the top of the resulting page you will have the option to switch between the My workflows, Workflows shared with me and Public workflows tabs.
- Select the tab you want to see all workflows in that category
Search for your desired workflow.
- Click on the workflow name: a pop-up window opens with a preview of the workflow.
- To run it directly: click Run (top-right).
- Recommended: click Import (left of Run) to make your own local copy under Workflows / My Workflows.
Run the “analyze_screen” workflow on the
PLK1screen using therulesfile.
Plot feature extraction results
Finally, we want to plot the results for better interpretation.
Hands On: Plot feature extraction results
- Click on the Visualize galaxy-barchart icon of the tool 4: Collapse Collection results.
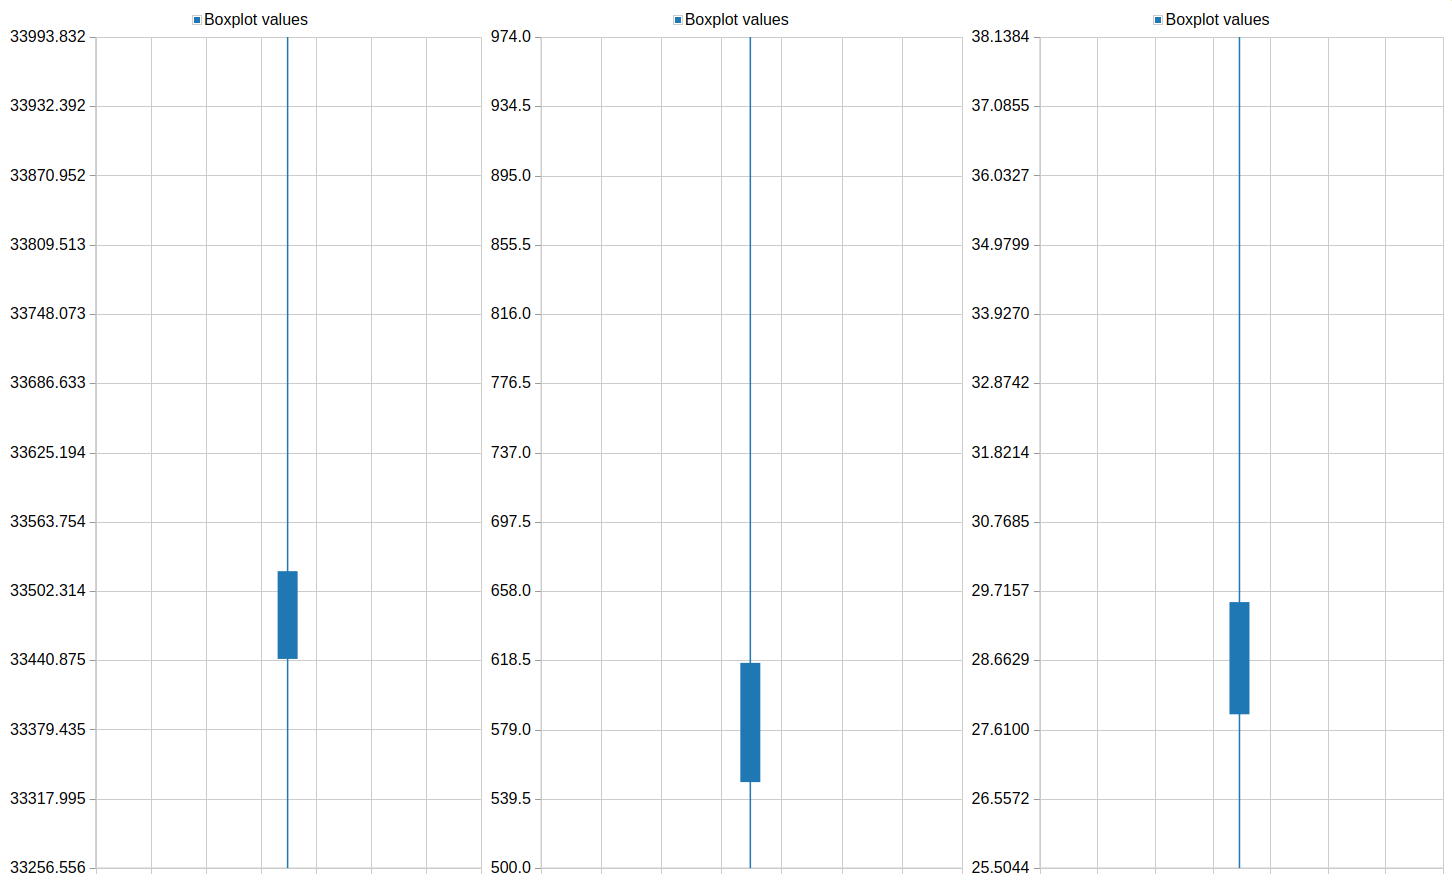
- Run Box plot (jqPlot) with the following parameters:
- “Provide a title”:
Screen features- “X-Axis label”:
- “Y-Axis label”:
- “1: Data series”:
- “Provide a label”:
Mean intensity- “Observations”:
Column 1- “2: Data series”:
- “Provide a label”:
Area- “Observations”:
Column 2- “3: Data series”:
- “Provide a label”:
Major axis length- “Observations”:
Column 3QuestionPlot the feature distribution of PLK1 and control. What differences do you observe between the screens?
The phenotype of PLK1 threated cells show a higher mean intensity and a shorter major axis in comparison to the control.
One of the resulting plots should look something like this:
Conclusion
In this exercise you imported images into Galaxy, segmented cell nuclei, filtered segmentations by morphological features, extracted features from segmentations, scaled your workflow to a whole screen, and plotted the feature extraction results using Galaxy.
You've Finished the Tutorial
Key points
Galaxy workflows can be used to scale image analysis pipelines to whole screens.
Segmented objects can be filtered using the Filter label map by rules tool.
Galaxy charts can be used to compare features extracted from screens showing cells with different treatments.
Frequently Asked Questions
Have questions about this tutorial? Have a look at the available FAQ pages and support channelsUseful literature
Further information, including links to documentation and original publications, regarding the tools, analysis techniques and the interpretation of results described in this tutorial can be found here.
Feedback
Did you use this material as an instructor? Feel free to give us feedback on how it went.
Did you use this material as a learner or student? Click the form below to leave feedback.

Citing this Tutorial
- Thomas Wollmann, Leonid Kostrykin, Analyse HeLa fluorescence siRNA screen (Galaxy Training Materials). https://training.galaxyproject.org/training-material/topics/imaging/tutorials/hela-screen-analysis/tutorial.html Online; accessed TODAY
- Hiltemann, Saskia, Rasche, Helena et al., 2023 Galaxy Training: A Powerful Framework for Teaching! PLOS Computational Biology 10.1371/journal.pcbi.1010752
- Batut et al., 2018 Community-Driven Data Analysis Training for Biology Cell Systems 10.1016/j.cels.2018.05.012
@misc{imaging-hela-screen-analysis,
author = "Thomas Wollmann and Leonid Kostrykin",
	title = "Analyse HeLa fluorescence siRNA screen (Galaxy Training Materials)",
	year = "",
	month = "",
	day = "",
	url = "\url{https://training.galaxyproject.org/training-material/topics/imaging/tutorials/hela-screen-analysis/tutorial.html}",
	note = "[Online; accessed TODAY]"
}
@article{Hiltemann_2023,
	doi = {10.1371/journal.pcbi.1010752},
	url = {https://doi.org/10.1371%2Fjournal.pcbi.1010752},
	year = 2023,
	month = {jan},
	publisher = {Public Library of Science ({PLoS})},
	volume = {19},
	number = {1},
	pages = {e1010752},
	author = {Saskia Hiltemann and Helena Rasche and Simon Gladman and Hans-Rudolf Hotz and Delphine Larivi{\`{e}}re and Daniel Blankenberg and Pratik D. Jagtap and Thomas Wollmann and Anthony Bretaudeau and Nadia Gou{\'{e}} and Timothy J. Griffin and Coline Royaux and Yvan Le Bras and Subina Mehta and Anna Syme and Frederik Coppens and Bert Droesbeke and Nicola Soranzo and Wendi Bacon and Fotis Psomopoulos and Crist{\'{o}}bal Gallardo-Alba and John Davis and Melanie Christine Föll and Matthias Fahrner and Maria A. Doyle and Beatriz Serrano-Solano and Anne Claire Fouilloux and Peter van Heusden and Wolfgang Maier and Dave Clements and Florian Heyl and Björn Grüning and B{\'{e}}r{\'{e}}nice Batut and},
	editor = {Francis Ouellette},
	title = {Galaxy Training: A powerful framework for teaching!},
	journal = {PLoS Comput Biol}
}
Funding
These individuals or organisations provided funding support for the development of this resource
Congratulations on successfully completing this tutorial!
Do you want to extend your knowledge?Follow one of our recommended follow-up trainings:
You can use Ephemeris's
shed-tools installcommand to install the tools used in this tutorial.shed-tools install [-g GALAXY] [-a API_KEY] -t <(curl https://training.galaxyproject.org/training-material/api/topics/imaging/tutorials/hela-screen-analysis/tutorial.json | jq .admin_install_yaml -r)Alternatively you can copy and paste the following YAML
---
install_tool_dependencies: true
install_repository_dependencies: true
install_resolver_dependencies: true
tools:
- name: 2d_auto_threshold
  owner: imgteam
  revisions: 699a5e9146b3
  tool_panel_section_label: Imaging
  tool_shed_url: https://toolshed.g2.bx.psu.edu/
- name: 2d_feature_extraction
  owner: imgteam
  revisions: 6a2b26c297a4
  tool_panel_section_label: Imaging
  tool_shed_url: https://toolshed.g2.bx.psu.edu/
- name: 2d_filter_segmentation_by_features
  owner: imgteam
  revisions: 9d47aabda459
  tool_panel_section_label: Imaging
  tool_shed_url: https://toolshed.g2.bx.psu.edu/
- name: 2d_simple_filter
  owner: imgteam
  revisions: d51310ab328a
  tool_panel_section_label: Imaging
  tool_shed_url: https://toolshed.g2.bx.psu.edu/
- name: binary2labelimage
  owner: imgteam
  revisions: 984358e43242
  tool_panel_section_label: Imaging
  tool_shed_url: https://toolshed.g2.bx.psu.edu/
- name: unzip
  owner: imgteam
  revisions: 57f0914ddb7b
  tool_panel_section_label: Collection Operations
  tool_shed_url: https://toolshed.g2.bx.psu.edu/
- name: collapse_collections
  owner: nml
  revisions: 90981f86000f
  tool_panel_section_label: Collection Operations
  tool_shed_url: https://toolshed.g2.bx.psu.edu/