Functional profiling of a bacterial genome with Eggsplorer
| Author(s) |

 Vesselin Baev
OverviewQuestions:
Objectives:
How can bacterial protein annotations be visualized as a functional profile from EggNOG mapper?
Which functional capabilities can be inferred from an Eggsplorer report?
Requirements:
Download the Pseudomonas aeruginosa PAO1 protein sequences from NCBI
Annotate proteins with eggNOG-mapper
Create and explore an Eggsplorer report
Examine the gene evidence supporting predicted functions
- Introduction to Galaxy Analyses
- Introduction to Galaxy Analyses
- tutorial Hands-on: Functional annotation of protein sequences
Time estimation: 1 hourLevel: Introductory IntroductorySupporting Materials:Published: Nov 2, 2026Last modification: Nov 2, 2026License: Tutorial Content is licensed under Creative Commons Attribution 4.0 International License. The GTN Framework is licensed under MITAI Policy: All GTN tutorials are human authored in accordance with our AI Policy .version Revision: 1
A bacterial proteome contains thousands of proteins. When a new bacterial genome is sequenced, we can annotate its proteins with eggNOG-mapper Cantalapiedra et al. 2021, which predicts their functions through annotation transfer from orthologous proteins in the eggNOG database Huerta-Cepas et al. 2019. Eggsplorer Baev 2026 can summarize the resulting annotations in an interactive report.
This tutorial uses the proteome of Pseudomonas aeruginosa PAO1 Stover et al. 2000, assembly GCF_000006765.1, to demonstrate protein retrieval, functional annotation and report interpretation in Galaxy.
For an introduction to protein annotation, see Functional annotation of protein sequences.
Agenda
Retrieve the protein sequences
The NCBI Datasets Genomes tool O’Leary et al. 2024 retrieves the protein sequences using the assembly accession.
Hands On: Download the PAO1 proteome
Create a new history for this tutorial and give it a name, for example
Eggsplorer PAO1To create a new history simply click the new-history icon at the top of the history panel:
- NCBI Datasets Genomes ( Galaxy version 18.39.0+galaxy0) with the following parameters:
- In “Query”:
- “Choose how to find genomes to download”:
By NCBI assembly or BioProject accession
- “Enter accession or read from file ?”:
Enter accessions
- “Enter comma separated list of accessions”:
GCF_000006765.1- In “Output options”:
- “Include”: select only
amino acid sequences (protein)(deselectgenomic sequence (genome))- “Decompress FASTA”:
YesComment: OutputsThe tool creates a tabular Data Report with the assembly metadata and a collection
NCBI Genome Datasets: protein fastawith one element,GCF_000006765.1, which holds the protein sequences.- Inspect the Data Report and the protein FASTA file

Question
- How many proteins are there in the FASTA file?
- The example dataset should contains 5572 protein sequences, each introduced by a
>header.
The protein sequences are provided in a collection with one element,
GCF_000006765.1. Select this collection as input for the next tool.
Annotate the proteins
eggNOG-mapper identifies related proteins and transfers functional annotations. These include functional categories, gene names and KEGG orthologs (KOs): identifiers used to group proteins with related functions Kanehisa and Goto 2000.
Hands On: Functional annotation with eggNOG-mapper
- eggNOG Mapper ( Galaxy version 2.1.13+galaxy0) with the following parameters:
- param-collection “Fasta sequences to annotate”:
NCBI Genome Datasets: protein fasta(output of NCBI Datasets Genomes tool)- “Version of eggNOG Database”: select an available version and record it for reproducibility
Comment: RuntimeRuntime depends on the computational resources and workload of the Galaxy server. Bacterial genomes should take around 30-50 min depending on the genome size.
Use the annotations output (*.emapper.annotations) for Eggsplorer.
Question
- Find
nosZin the annotations table. Which KO is assigned to it?
K00376. The protein is annotated as nitrous oxide reductase. Its role is examined further in the nitrogen cycle section.
Create the Eggsplorer report
Hands On: Create the interactive report
- Eggsplorer ( Galaxy version 1.1.0+galaxy0) with the following parameters:
- param-collection “eggNOG-mapper annotations”: the
annotationsoutput of eggNOG Mapper tool- “Sample name”:
Pseudomonas aeruginosa PAO1(the title of the report; if left empty, the dataset name is used)- “Also output summary tables”:
YesOpen the report with the galaxy-eye icon
Download the HTML report with the galaxy-save icon and open it in your browser. Galaxy may block the JavaScript needed for the charts. The report can be opened offline.
The summary tables contain counts and scores for further analysis in Galaxy.
Explore the Eggsplorer report
The answers below refer to the PAO1 report generated with Eggsplorer 1.1.0. Results may vary with the protein annotation and eggNOG-mapper database version.
Overview
The overview summarises protein counts and annotation coverage, defined as the proportion of proteins with an entry in a given annotation field.
Question
- How many proteins are classified as annotated in the report?
- How many unique KOs were found?
- 5163 of 5479 proteins, about 94%. This does not mean that every protein has a known function.
- 2790 unique KOs, assigned to 3455 proteins. Multiple proteins may share the same KO assignment.
The taxonomy section shows the taxonomic levels used for annotation transfer. In this report, the most common max_annot_lvl is Gammaproteobacteria (5300 proteins).
COG and GO
COG categories group proteins by function Tatusov et al. 2000. Clusters of Orthologous Groups (COG) is a database and classification system, developed at NCBI, that groups proteins from completely sequenced genomes into orthologous clusters, each assigned to a functional category. It is used to infer protein function by transferring annotation from well-characterized organisms to newly sequenced ones. Hover over the chart to see the category names and counts.
Question
- Which COG category has the most proteins?
- Find category E. What does it describe?
- S, Function unknown, with 1176 proteins. A protein can have a COG assignment while its function remains unknown.
- Amino acid transport and metabolism, with 552 proteins.
Gene Ontology (GO) terms describe biological processes, molecular functions and cellular components. The charts show the most frequent terms in each group.
Comment: GO term frequencyGO term frequency does not establish enrichment. The report summarises annotation counts without statistical comparison against a background set.
Cell overview
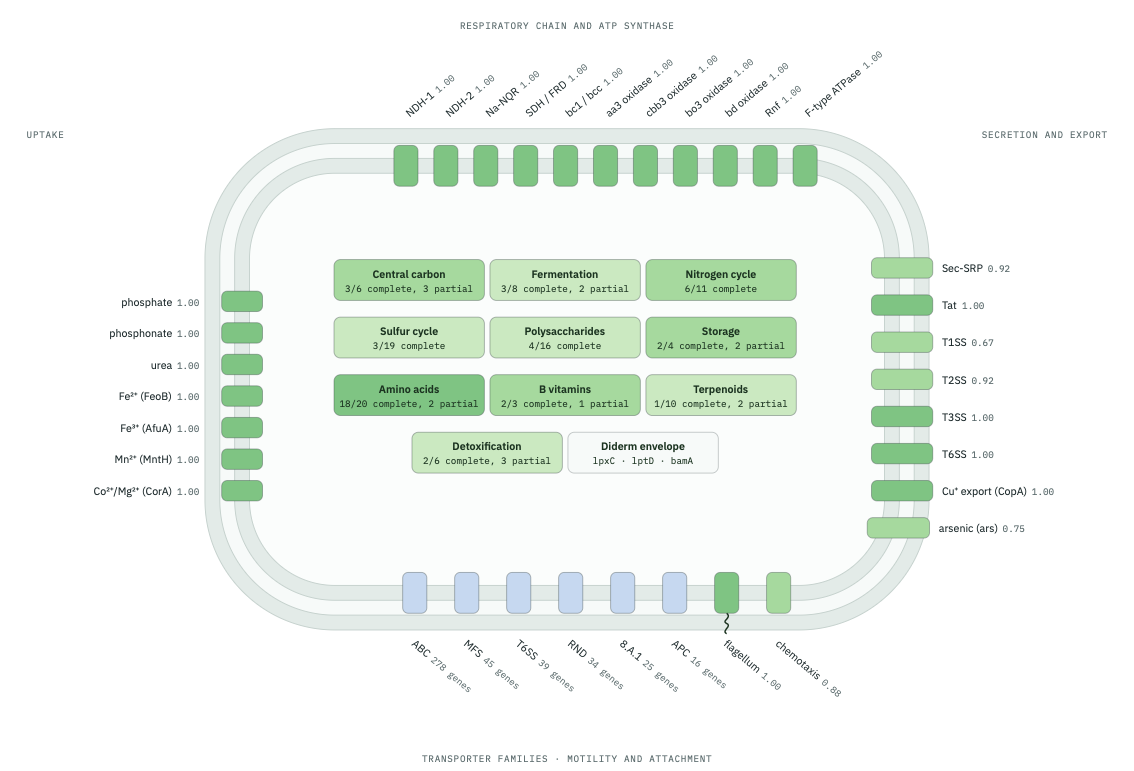
The cell diagram displays predicted cellular components: respiration at the top, uptake on the left, secretion on the right and motility at the bottom. Darker components have higher completeness scores. The layout is a functional schematic, not a map of subcellular location.
 Open image in new tab
Question
- Find type I secretion (T1SS). What is the completeness score?
- Find again the T1SS in “Metabolic function completeness” section, click it and see the details. Which KO is missing?
- 0.67, based on the detection of two of the three KOs specified in the definition.
K11003. A missing KO assignment alone does not establish the absence or inactivity of the system.
Metabolic functions
This section evaluates functional completeness using KEGG-Decoder definitions Graham et al. 2018. Eggsplorer also provides corrected scores. A score of 1.00 indicates that the detected annotations satisfy the scoring rule for that function.
Click a function to inspect the supporting proteins, detected KOs and gaps.
Question
- Find nitrous-oxide reduction. What is its corrected score and which protein supports it?
- Does a score of 1.00 mean that the reaction is active?
- 1.00, supported by
nosZ(NP_252082.1, KOK00376).- No. It indicates that the required annotation was detected. Gene expression and enzyme activity are not measured in this analysis.
Nitrogen and sulfur cycles
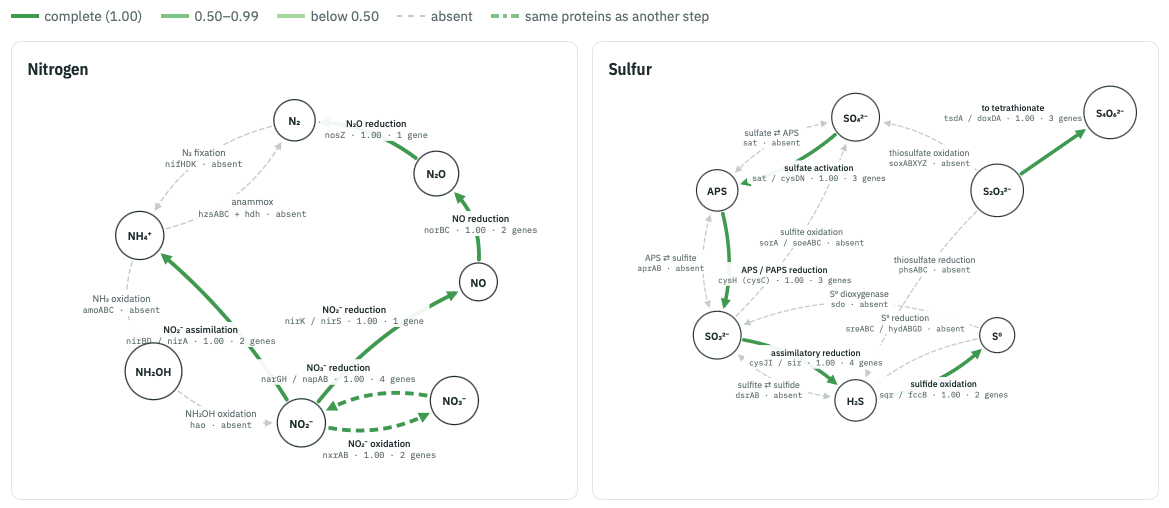
The cycle diagrams connect individual functions into pathways. Follow the arrows to examine the gene evidence supporting each step.
 Open image in new tab
Question
- Trace the pathway from nitrate (NO3-) to nitrogen gas (N2) in the nitrogen cycle. Are all four steps supported?
- Find nitrogen fixation (N2 → NH4+) in the metabolic function details. Were any of its required KOs found?
- Yes. Nitrate reduction (NO3- → NO2-), nitrite reduction (NO2- → NO), nitric oxide reduction (NO → N2O) and nitrous-oxide reduction (N2O → N2) all have corrected scores of 1.00. Together they support a prediction of complete denitrification.
- No. Its score is 0, with no assignments for the required nitrogenase KOs. Nitrogen fixation and denitrification are different processes.
Nitrite oxidation also has a score of 1.00. However, the report identifies shared KOs (
K00370,K00371) with nitrate reductase. These assignments alone cannot distinguish the physiological roles of the proteins.
In the sulfur diagram, the inner route from sulfate to sulfide represents assimilatory sulfate reduction, which supplies reduced sulfur for biosynthesis. This pathway does not establish a capacity for sulfate respiration.
Transporters, enzymes and protein families
The remaining sections group transporters (TC), enzymes (EC), carbohydrate-active enzyme families (CAZy) and protein domains (Pfam). Hover over the charts to inspect their labels and counts.
Question
- Which transporter family has the most proteins?
- Which Pfam domain is most frequent?
- The ATP-binding cassette (ABC) superfamily,
3.A.1, with 278 proteins.HTH_1, with 122 proteins.
Examine individual protein annotations
The searchable gene table links the report summaries to individual protein annotations.
Question
- Search for
nosZ. What EC number does it have?
1.7.2.4. This is the same protein used in the nitrous-oxide reduction example.
Conclusion
In this tutorial we downloaded the proteome of Pseudomonas aeruginosa PAO1 from NCBI with a single accession, annotated all its proteins with eggNOG-mapper and summarised the annotation with Eggsplorer. The report shows the potential of the genome, inferred by orthology; it does not show which genes are expressed under a given condition. The same workflow can be run on any bacterial proteome: one from NCBI, as here, or the proteins predicted by Bakta or Prokka for your own genome assembly.
Comment: Citing EggsplorerCite Eggsplorer Baev 2026 and eggNOG-mapper Cantalapiedra et al. 2021 when using these tools. For metabolic function scores, also cite KEGG-Decoder Graham et al. 2018 and KEGG Kanehisa and Goto 2000; for the CAZy-by-substrate chart, dbCAN3 Zheng et al. 2023.
You've Finished the Tutorial
Key points
eggNOG-mapper predicts protein functions from related sequences.
Eggsplorer summarises the eggNOG-mapper annotations in an interactive report.
We should point that completeness scores indicate annotation support for a function, rather than biological activity.
Shared KO assignments require careful interpretation.
Frequently Asked Questions
Have questions about this tutorial? Have a look at the available FAQ pages and support channelsReferences
- Kanehisa, M., and S. Goto, 2000 KEGG: Kyoto Encyclopedia of Genes and Genomes. Nucleic Acids Research 28: 27–30. 10.1093/nar/28.1.27
- Stover, C. K., X. Q. Pham, A. L. Erwin, S. D. Mizoguchi, P. Warrener et al., 2000 Complete genome sequence of \emphPseudomonas aeruginosa PAO1, an opportunistic pathogen. Nature 406: 959–964. 10.1038/35023079
- Tatusov, R. L., M. Y. Galperin, D. A. Natale, and E. V. Koonin, 2000 The COG database: a tool for genome-scale analysis of protein functions and evolution. Nucleic Acids Research 28: 33–36. 10.1093/nar/28.1.33
- Graham, E. D., J. F. Heidelberg, and B. J. Tully, 2018 Potential for primary productivity in a globally-distributed bacterial phototroph. The ISME Journal 12: 1861–1866. 10.1038/s41396-018-0091-3
- Huerta-Cepas, J., D. Szklarczyk, D. Heller, A. Hernández-Plaza, S. K. Forslund et al., 2019 eggNOG 5.0: a hierarchical, functionally and phylogenetically annotated orthology resource based on 5090 organisms and 2502 viruses. Nucleic Acids Research 47: D309–D314. 10.1093/nar/gky1085
- Cantalapiedra, C. P., A. Hernández-Plaza, I. Letunic, P. Bork, and J. Huerta-Cepas, 2021 eggNOG-mapper v2: Functional Annotation, Orthology Assignments, and Domain Prediction at the Metagenomic Scale. Molecular Biology and Evolution 38: 5825–5829. 10.1093/molbev/msab293
- Zheng, J., Q. Ge, Y. Yan, X. Zhang, L. Huang et al., 2023 dbCAN3: automated carbohydrate-active enzyme and substrate annotation. Nucleic Acids Research 51: W115–W121. 10.1093/nar/gkad328
- O’Leary, N. A., E. Cox, J. B. Holmes, W. R. Anderson, R. Falk et al., 2024 Exploring and retrieving sequence and metadata for species across the tree of life with NCBI Datasets. Scientific Data 11: 732. 10.1038/s41597-024-03571-y
- Baev, V., 2026 Eggsplorer: Galaxy Tool for Interactive Exploration of eggNOG-mapper Functional Annotations of Bacterial Genomes. Submitted to Current Issues in Molecular Biology; citation to be announced. https://github.com/vebaev/eggsplorer
Glossary
- CAZy
- Carbohydrate-Active enZYmes
- COG
- Clusters of Orthologous Genes
- EC
- Enzyme Commission
- GO
- Gene Ontology
- KEGG
- Kyoto Encyclopedia of Genes and Genomes
- KO
- KEGG Orthology
Feedback
Did you use this material as an instructor? Feel free to give us feedback on how it went.
Did you use this material as a learner or student? Click the form below to leave feedback.
Citing this Tutorial
- Vesselin Baev, Functional profiling of a bacterial genome with Eggsplorer (Galaxy Training Materials). https://training.galaxyproject.org/training-material/topics/genome-annotation/tutorials/eggsplorer/tutorial.html Online; accessed TODAY
- Hiltemann, Saskia, Rasche, Helena et al., 2023 Galaxy Training: A Powerful Framework for Teaching! PLOS Computational Biology 10.1371/journal.pcbi.1010752
- Batut et al., 2018 Community-Driven Data Analysis Training for Biology Cell Systems 10.1016/j.cels.2018.05.012
Congratulations on successfully completing this tutorial!@misc{genome-annotation-eggsplorer, author = "Vesselin Baev", title = "Functional profiling of a bacterial genome with Eggsplorer (Galaxy Training Materials)", year = "", month = "", day = "", url = "\url{https://training.galaxyproject.org/training-material/topics/genome-annotation/tutorials/eggsplorer/tutorial.html}", note = "[Online; accessed TODAY]" } @article{Hiltemann_2023, doi = {10.1371/journal.pcbi.1010752}, url = {https://doi.org/10.1371%2Fjournal.pcbi.1010752}, year = 2023, month = {jan}, publisher = {Public Library of Science ({PLoS})}, volume = {19}, number = {1}, pages = {e1010752}, author = {Saskia Hiltemann and Helena Rasche and Simon Gladman and Hans-Rudolf Hotz and Delphine Larivi{\`{e}}re and Daniel Blankenberg and Pratik D. Jagtap and Thomas Wollmann and Anthony Bretaudeau and Nadia Gou{\'{e}} and Timothy J. Griffin and Coline Royaux and Yvan Le Bras and Subina Mehta and Anna Syme and Frederik Coppens and Bert Droesbeke and Nicola Soranzo and Wendi Bacon and Fotis Psomopoulos and Crist{\'{o}}bal Gallardo-Alba and John Davis and Melanie Christine Föll and Matthias Fahrner and Maria A. Doyle and Beatriz Serrano-Solano and Anne Claire Fouilloux and Peter van Heusden and Wolfgang Maier and Dave Clements and Florian Heyl and Björn Grüning and B{\'{e}}r{\'{e}}nice Batut and}, editor = {Francis Ouellette}, title = {Galaxy Training: A powerful framework for teaching!}, journal = {PLoS Comput Biol} }
You can use Ephemeris's
shed-tools installcommand to install the tools used in this tutorial.shed-tools install [-g GALAXY] [-a API_KEY] -t <(curl https://training.galaxyproject.org/training-material/api/topics/genome-annotation/tutorials/eggsplorer/tutorial.json | jq .admin_install_yaml -r)Alternatively you can copy and paste the following YAML
---
install_tool_dependencies: true
install_repository_dependencies: true
install_resolver_dependencies: true
tools:
- name: eggnog_mapper
  owner: galaxyp
  revisions: '02439eb2b37d'
  tool_panel_section_label: Proteomics
  tool_shed_url: https://toolshed.g2.bx.psu.edu/
- name: eggsplorer
  owner: galaxyp
  revisions: 8713c7ecec38
  tool_panel_section_label: Annotation
  tool_shed_url: https://toolshed.g2.bx.psu.edu/
- name: ncbi_datasets
  owner: iuc
  revisions: 067dcb71f976
  tool_panel_section_label: Get Data
  tool_shed_url: https://toolshed.g2.bx.psu.edu/