name: inverse layout: true class: center, middle, inverse <div class="my-header"><span> <a href="/training-material/topics/dev" title="Return to topic page" ><i class="fa fa-level-up" aria-hidden="true"></i></a> <a href="https://github.com/galaxyproject/training-material/edit/main/topics/dev/tutorials/visualization-generic/slides.html"><i class="fa fa-pencil" aria-hidden="true"></i></a> </span></div> <div class="my-footer"><span> <img src="/training-material/assets/images/GTN-60px.png" alt="Galaxy Training Network" style="height: 40px;"/> </span></div> --- <img src="/training-material/assets/images/GTNLogo1000.png" alt="Galaxy Training Network" class="cover-logo"/> <br/> <br/> # Generic plugins <br/> <br/> <div markdown="0"> <div class="contributors-line"> <ul class="text-list"> <li> <a href="/training-material/hall-of-fame/shiltemann/" class="contributor-badge contributor-shiltemann"><img src="/training-material/assets/images/orcid.png" alt="orcid logo" width="36" height="36"/><img src="https://avatars.githubusercontent.com/shiltemann?s=36" alt="Saskia Hiltemann avatar" width="36" class="avatar" /> Saskia Hiltemann</a> <li> <a href="/training-material/hall-of-fame/yhoogstrate/" class="contributor-badge contributor-yhoogstrate"><img src="https://avatars.githubusercontent.com/yhoogstrate?s=36" alt="Youri Hoogstrate avatar" width="36" class="avatar" /> Youri Hoogstrate</a></li> </ul> </div> </div> <!-- modified date --> <div class="footnote" style="bottom: 8em;"> <i class="far fa-calendar" aria-hidden="true"></i><span class="visually-hidden">last_modification</span> Updated: <i class="fas fa-fingerprint" aria-hidden="true"></i><span class="visually-hidden">purl</span><abbr title="Persistent URL">PURL</abbr>: <a href="https://gxy.io/GTN:S00054">gxy.io/GTN:S00054</a> </div> <!-- other slide formats (video and plain-text) --> <div class="footnote" style="bottom: 5em;"> <i class="fas fa-file-alt" aria-hidden="true"></i><span class="visually-hidden">text-document</span><a href="slides-plain.html"> Plain-text slides</a> | </div> <!-- usage tips --> <div class="footnote" style="bottom: 2em;"> <strong>Tip: </strong>press <kbd>P</kbd> to view the presenter notes | <i class="fa fa-arrows" aria-hidden="true"></i><span class="visually-hidden">arrow-keys</span> Use arrow keys to move between slides </div> ??? Presenter notes contain extra information which might be useful if you intend to use these slides for teaching. Press `P` again to switch presenter notes off Press `C` to create a new window where the same presentation will be displayed. This window is linked to the main window. Changing slides on one will cause the slide to change on the other. Useful when presenting. --- ## Requirements Before diving into this slide deck, we recommend you to have a look at: - Javascript knowledge --- ### <i class="far fa-question-circle" aria-hidden="true"></i><span class="visually-hidden">question</span> Questions - How can visualization plugins benefit science? --- ### <i class="fas fa-bullseye" aria-hidden="true"></i><span class="visually-hidden">objectives</span> Objectives - Implement a first Galaxy visualization - Understand the client side vs. server side principle --- ## Why visualizations?  ```python X mean: 54.26, X SD: 16.76 Y mean: 47.83, Y SD: 26.93 Corr: -0.06 ``` ??? Anscombes quartet, all these datasets have same mean, standard deviation and correlation, yet when visualizing them it is revealed they have vastly different structures. --- ## Why visualizations? Bam files - textual  --- ## Why visualizations? Bam files - visualized 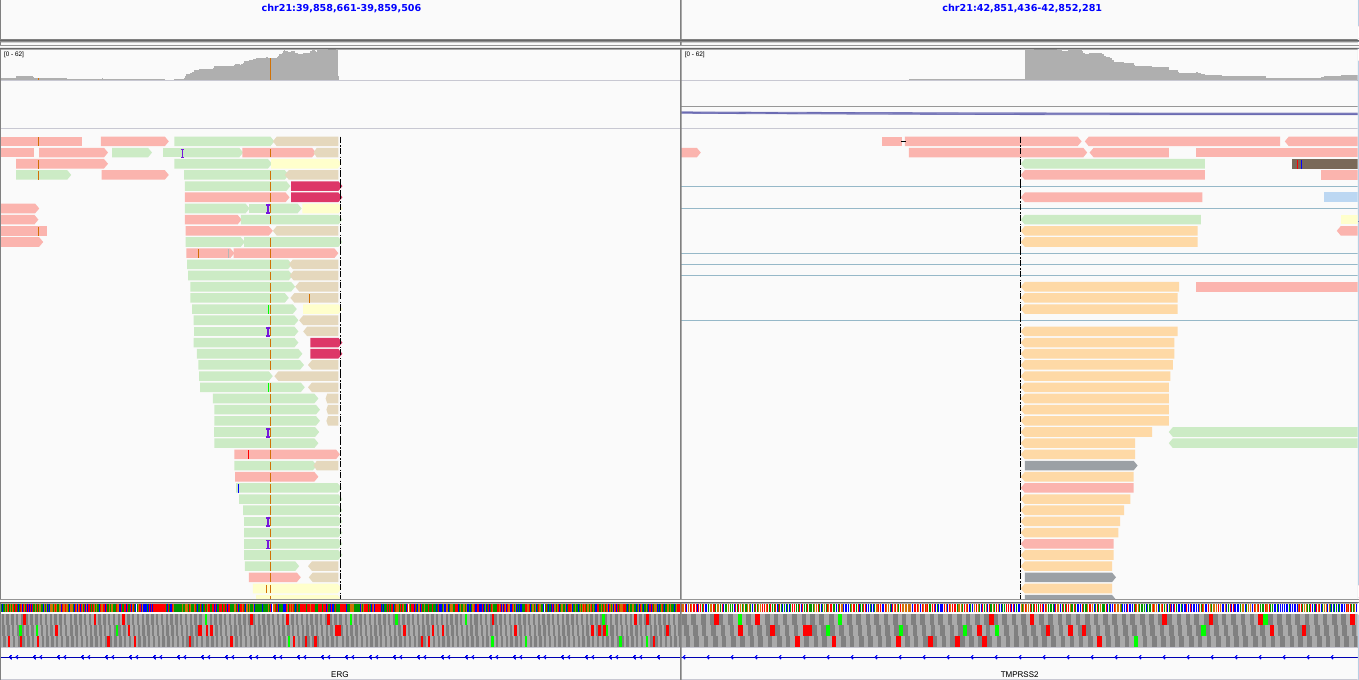 --- ## Types of visualizations in Galaxy - **Trackster** - built-in genome browser - **Display applications** - UCSC Genome Browser - IGV - **Galaxy tools** - JBrowse - Krona - **Visualization plugins** - Charts - Generic - **Interactive Environments** - Jupyter/Rstudio - IOBIO (bam/vcf visualizations) - Phinch (metagenomics visualizations) --- ## Which should I use? 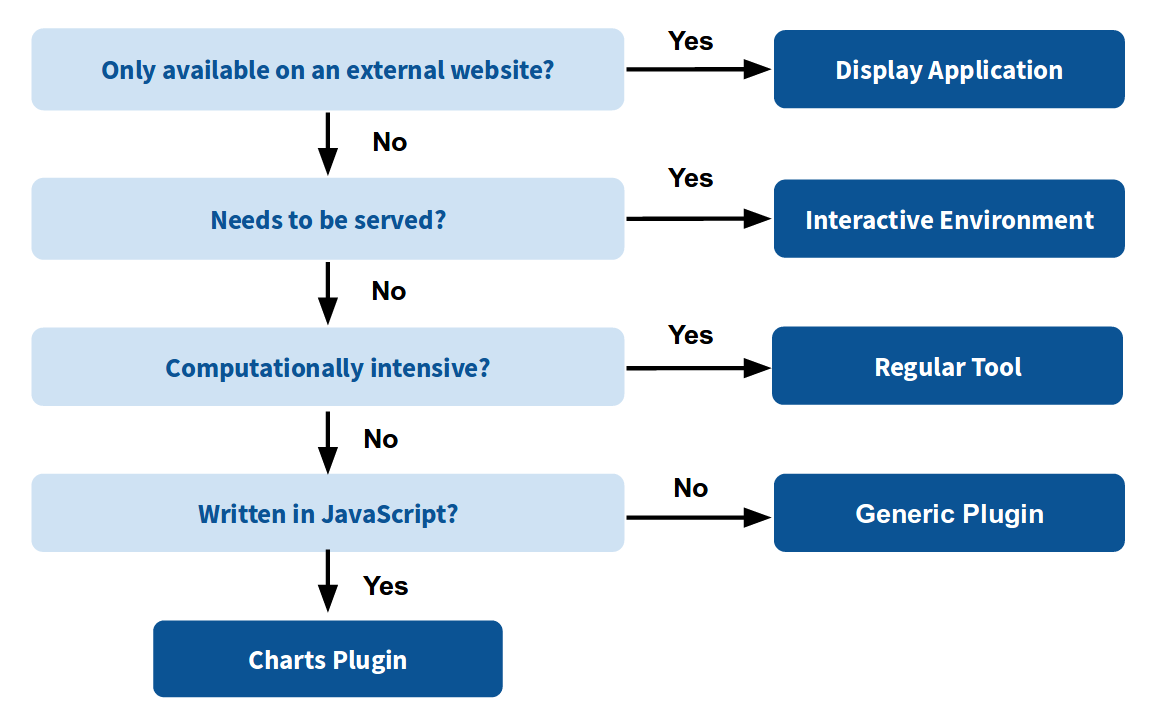 --- ## Plugins - Visualizations button on history items - Different options depending on file type 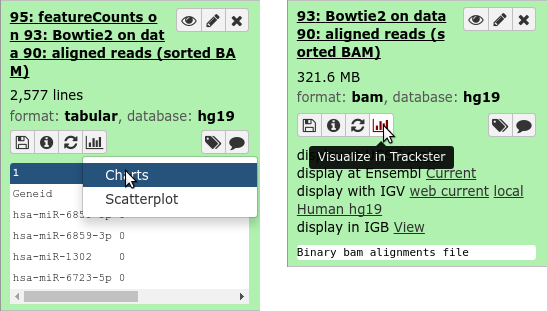 --- .enlarge120[ ## Plugins: Charts ] .pull-left[ 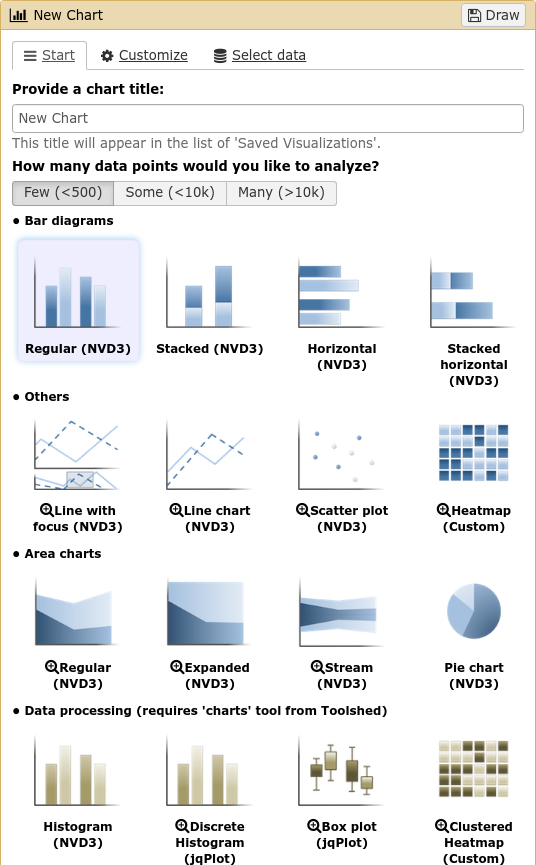 ] .pull-right[ 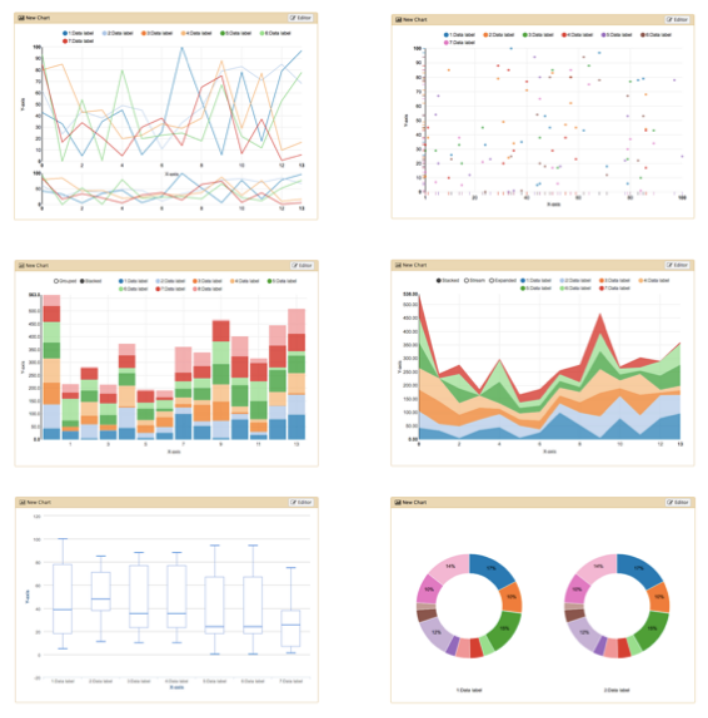 ] --- ## Plugins: Charts - Allows exporting screenshots 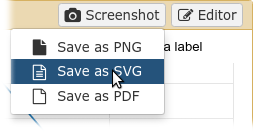 - For more information, see the charts plugin development [slides](/training-material/topics/dev/tutorials/visualization-charts/slides.html) and [tutorial](/training-material/topics/dev/tutorials/visualization-charts/tutorial.html) --- ## Plugins: Generic - Elements of visualization plugin: * Configuration (name, description, datatype) * Template * Static resources (js, css, images) - Project Structure * located in `$GALAXY_ROOT/config/plugins/$PLUGIN_NAME` ``` myviz ├── config │ └── myviz.xml ├── static │ ├── css │ ├── img │ └── js └── templates └── myviz.mako ``` --- ## Plugins: XML file ```bash $ touch $GALAXY_ROOT/config/plugins/$PLUGIN_NAME/config/$PLUGIN_NAME.xml ``` - Hooks visualizations into Galaxy 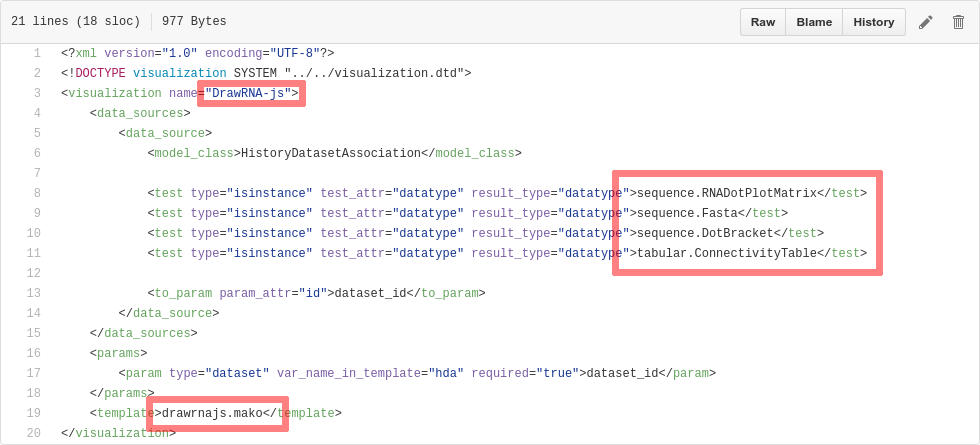 * Data types must match with class names in `$GALAXY_ROOT/lib/galaxy/datatypes/` --- ## Plugins: Mako file - For templates of HTML files: ```bash $ touch $GALAXY_ROOT/config/plugins/$PLUGIN_NAME/templates/$PLUGIN_NAME.mako ``` - Link to data types and HTML template file * Every invocation of visualization: template compiled 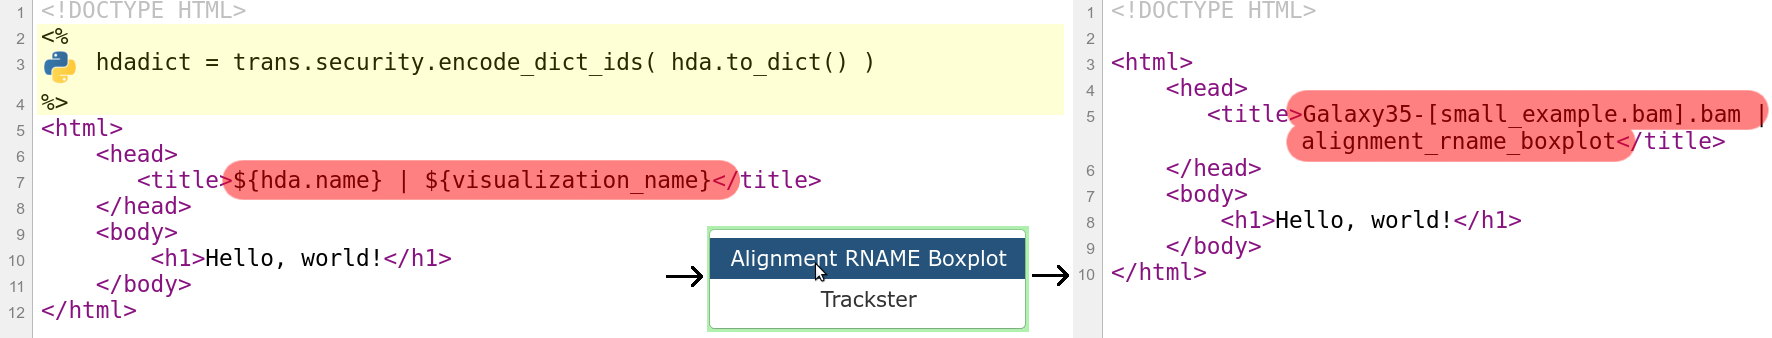 --- ## Plugins: Mako file - Access to the history item (*hda*) **pre** template compilation: * `$hda.file_name` * `$hda.metadata.dbkey` * Avoid (unnecessary) copies of whole files - Access to *hda* **post** template compilation -> via URLs * Download data file by browser (client side) - Inconvenient for large files: * Indices and query protocols (e.g. DAS protocol) * Resolving history uid to hash * Correction for extended root URLs:  --- ## Plugins: Mako syntax - Access to *hda* **post** template compilation: - Obtain hash value used in urls *hdadict['id']* - Essential Python variables: 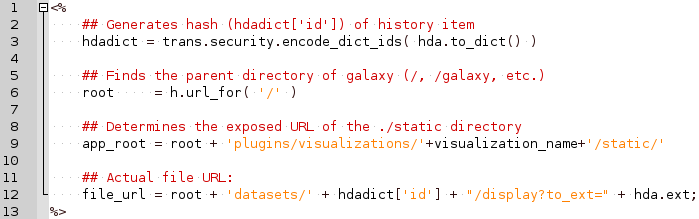 --- ## Plugins: Javascript and jQuery - HTML / JS implementation make often use of jQuery * Galaxy ships with jQuery ```html <script type="text/javascript" src="${root}/static/scripts/libs/jquery/jquery.js" /> ``` --- ## Plugins: Generic template 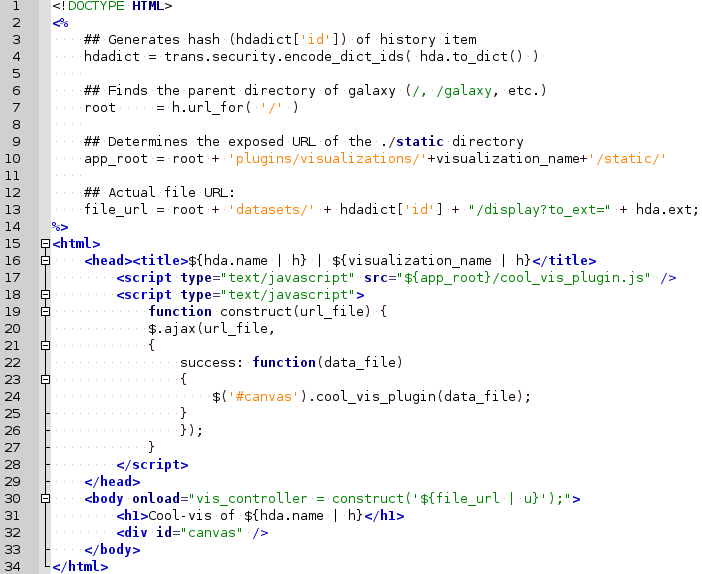 --- ### Plugins: Static files - External libraries and static files go in `./static` dir:  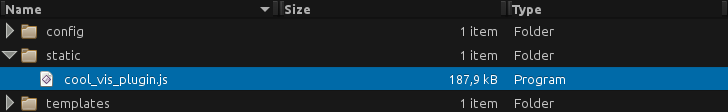 --- ## Plugins: Summary - Galaxy visualization plugins: * Datatype-specific * Written in HTML5 / JS * Require minor python / Galaxy ecosystem knowledge * Have access to the whole Galaxy system - pre-compilation: python - post-compilation: JS / API * Can be installed without additional configuration * Can not be connected to workflows * Can not (out of the box) save and share --- ## Plugins: More tips and tricks - Galaxy has UI guidelines with corresponding CSS (https://wiki.galaxyproject.org/VisualizationsRegistry/Cookbook) - Look at existing plugins: * Galaxy mainline * https://github.com/bgruening/galaxytools/tree/master/visualisations - API is now very extensive, everything is accessible with jQuery! --- ### <i class="fas fa-key" aria-hidden="true"></i><span class="visually-hidden">keypoints</span> Key points - Visualizations require a different way of thinking: server and client side; downloading files rather than system level access - Interactivity is what makes visualizations different from static tools - Requires understanding of both the Galaxy ecosystem as well as HTML5/JS - Performance is more important than for static Galaxy tools --- ## Thank You! This material is the result of a collaborative work. Thanks to the [Galaxy Training Network](https://training.galaxyproject.org) and all the contributors! <div markdown="0"> <div class="contributors-line"> <table class="contributions"> <tr> <td><abbr title="These people wrote the bulk of the tutorial, they may have done the analysis, built the workflow, and wrote the text themselves.">Author(s)</abbr></td> <td> <a href="/training-material/hall-of-fame/shiltemann/" class="contributor-badge contributor-shiltemann"><img src="/training-material/assets/images/orcid.png" alt="orcid logo" width="36" height="36"/><img src="https://avatars.githubusercontent.com/shiltemann?s=36" alt="Saskia Hiltemann avatar" width="36" class="avatar" /> Saskia Hiltemann</a><a href="/training-material/hall-of-fame/yhoogstrate/" class="contributor-badge contributor-yhoogstrate"><img src="https://avatars.githubusercontent.com/yhoogstrate?s=36" alt="Youri Hoogstrate avatar" width="36" class="avatar" /> Youri Hoogstrate</a> </td> </tr> <tr class="reviewers"> <td><abbr title="These people reviewed this material for accuracy and correctness">Reviewers</abbr></td> <td> <a href="/training-material/hall-of-fame/nsoranzo/" class="contributor-badge contributor-badge-small contributor-nsoranzo"><img src="https://avatars.githubusercontent.com/nsoranzo?s=36" alt="Nicola Soranzo avatar" width="36" class="avatar" /></a><a href="/training-material/hall-of-fame/shiltemann/" class="contributor-badge contributor-badge-small contributor-shiltemann"><img src="https://avatars.githubusercontent.com/shiltemann?s=36" alt="Saskia Hiltemann avatar" width="36" class="avatar" /></a><a href="/training-material/hall-of-fame/hexylena/" class="contributor-badge contributor-badge-small contributor-hexylena"><img src="https://avatars.githubusercontent.com/hexylena?s=36" alt="Helena Rasche avatar" width="36" class="avatar" /></a><a href="/training-material/hall-of-fame/bebatut/" class="contributor-badge contributor-badge-small contributor-bebatut"><img src="https://avatars.githubusercontent.com/bebatut?s=36" alt="Bérénice Batut avatar" width="36" class="avatar" /></a><a href="/training-material/hall-of-fame/lecorguille/" class="contributor-badge contributor-badge-small contributor-lecorguille"><img src="https://avatars.githubusercontent.com/lecorguille?s=36" alt="Gildas Le Corguillé avatar" width="36" class="avatar" /></a><a href="/training-material/hall-of-fame/gallardoalba/" class="contributor-badge contributor-badge-small contributor-gallardoalba"><img src="https://avatars.githubusercontent.com/gallardoalba?s=36" alt="Cristóbal Gallardo avatar" width="36" class="avatar" /></a><a href="/training-material/hall-of-fame/bgruening/" class="contributor-badge contributor-badge-small contributor-bgruening"><img src="https://avatars.githubusercontent.com/bgruening?s=36" alt="Björn Grüning avatar" width="36" class="avatar" /></a><a href="/training-material/hall-of-fame/yhoogstrate/" class="contributor-badge contributor-badge-small contributor-yhoogstrate"><img src="https://avatars.githubusercontent.com/yhoogstrate?s=36" alt="Youri Hoogstrate avatar" width="36" class="avatar" /></a><a href="/training-material/hall-of-fame/njall/" class="contributor-badge contributor-badge-small contributor-njall"><img src="https://avatars.githubusercontent.com/njall?s=36" alt="Niall Beard avatar" width="36" class="avatar" /></a></td> </tr> </table> </div> </div> <div style="display: flex;flex-direction: row;align-items: center;justify-content: center;"> <img src="/training-material/assets/images/GTNLogo1000.png" alt="Galaxy Training Network" style="height: 100px;"/> </div> Tutorial Content is licensed under <a rel="license" href="http://creativecommons.org/licenses/by/4.0/">Creative Commons Attribution 4.0 International License</a>.<br/>