Phylogenetics - Back to Basics - Introduction
Contributors
last_modification Published: May 10, 2024
last_modification Last Updated: May 10, 2024
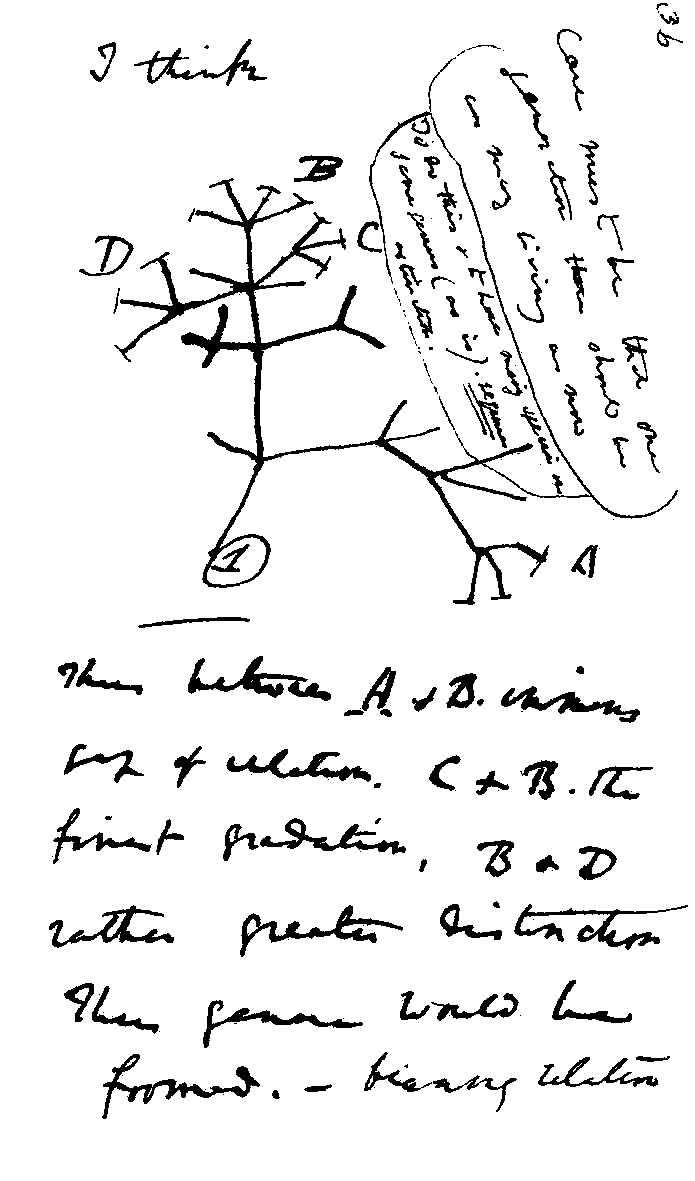
Charles Darwin, 1837 Notebeook entry
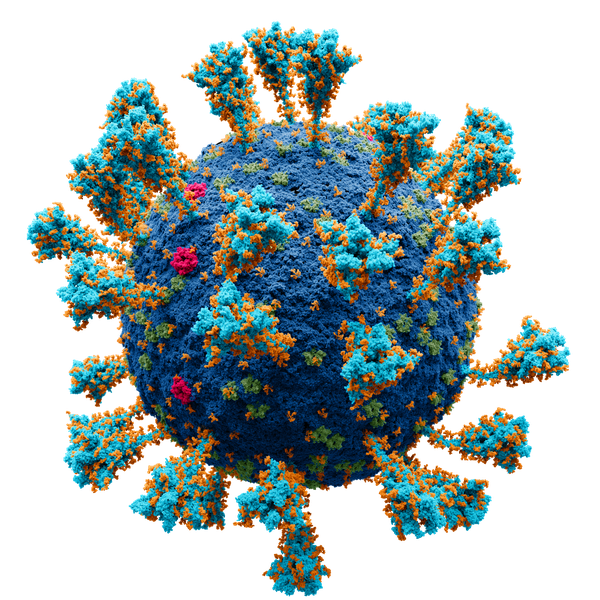 .right[https://en.wikipedia.org/wiki/Coronavirus; CC BY-SA 4.0]
—
.right[https://en.wikipedia.org/wiki/Coronavirus; CC BY-SA 4.0]
—
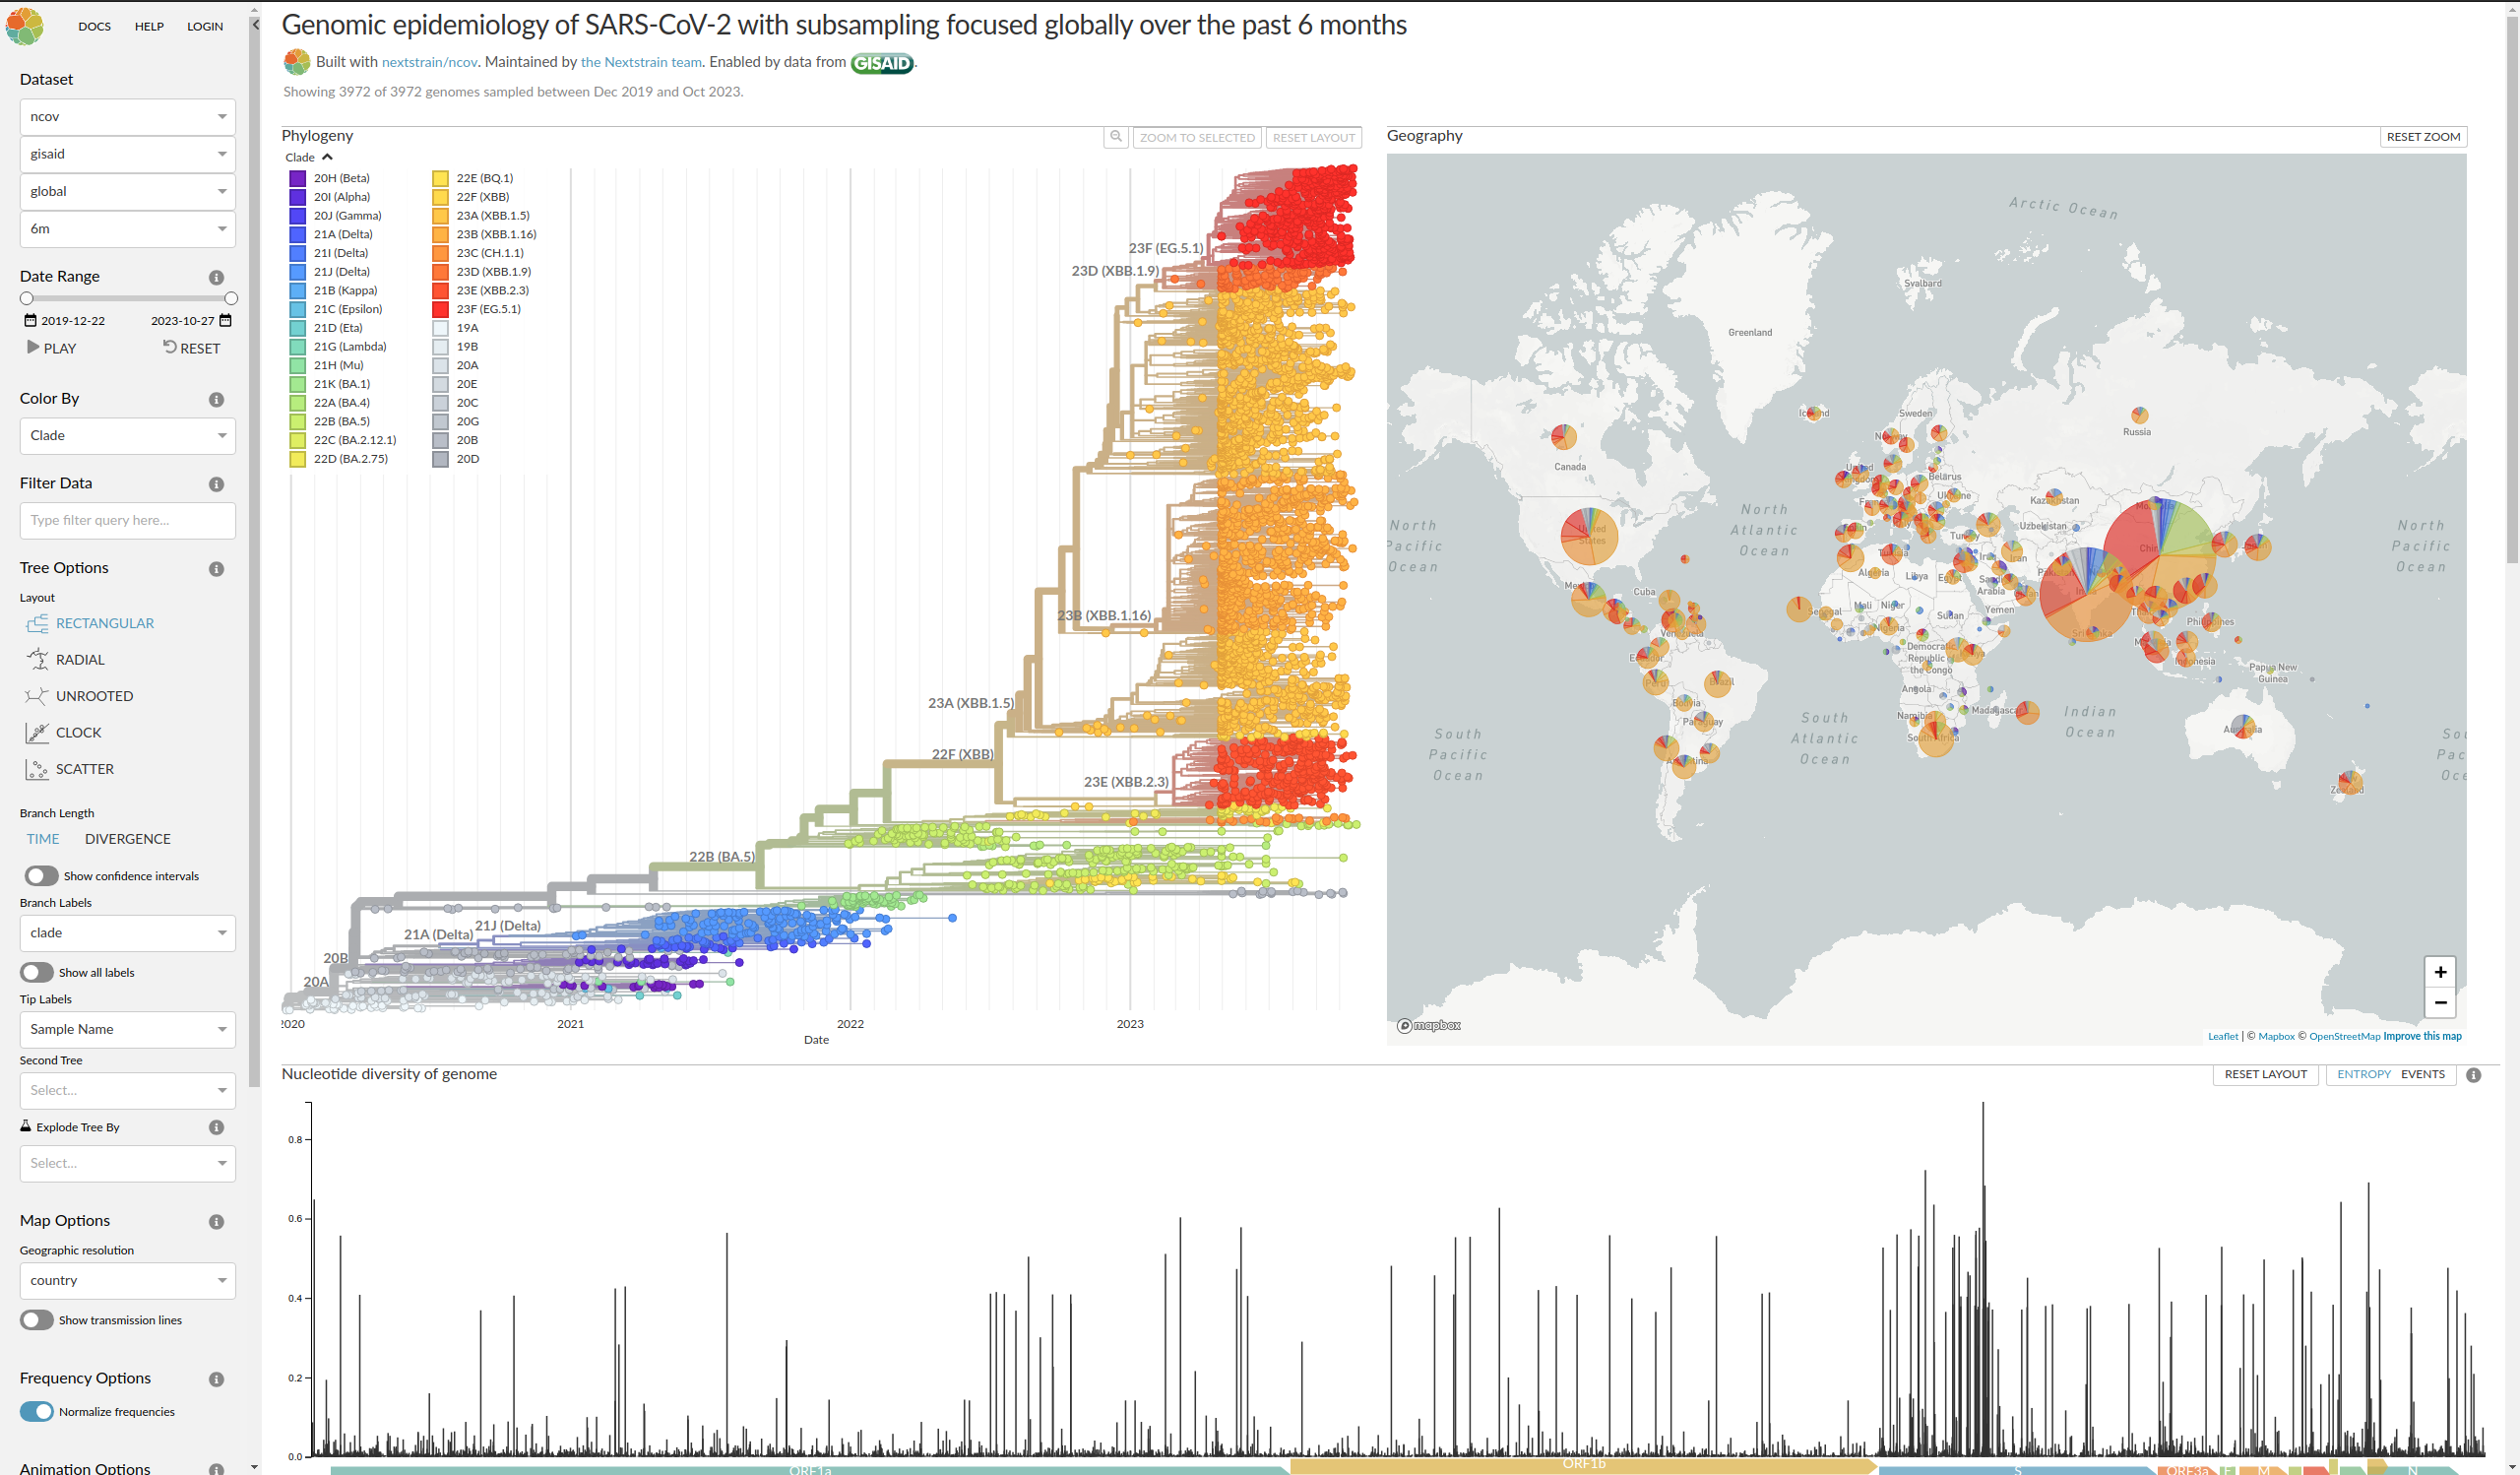 .right[https://nextstrain.org/ncov/gisaid/global/6m]
—
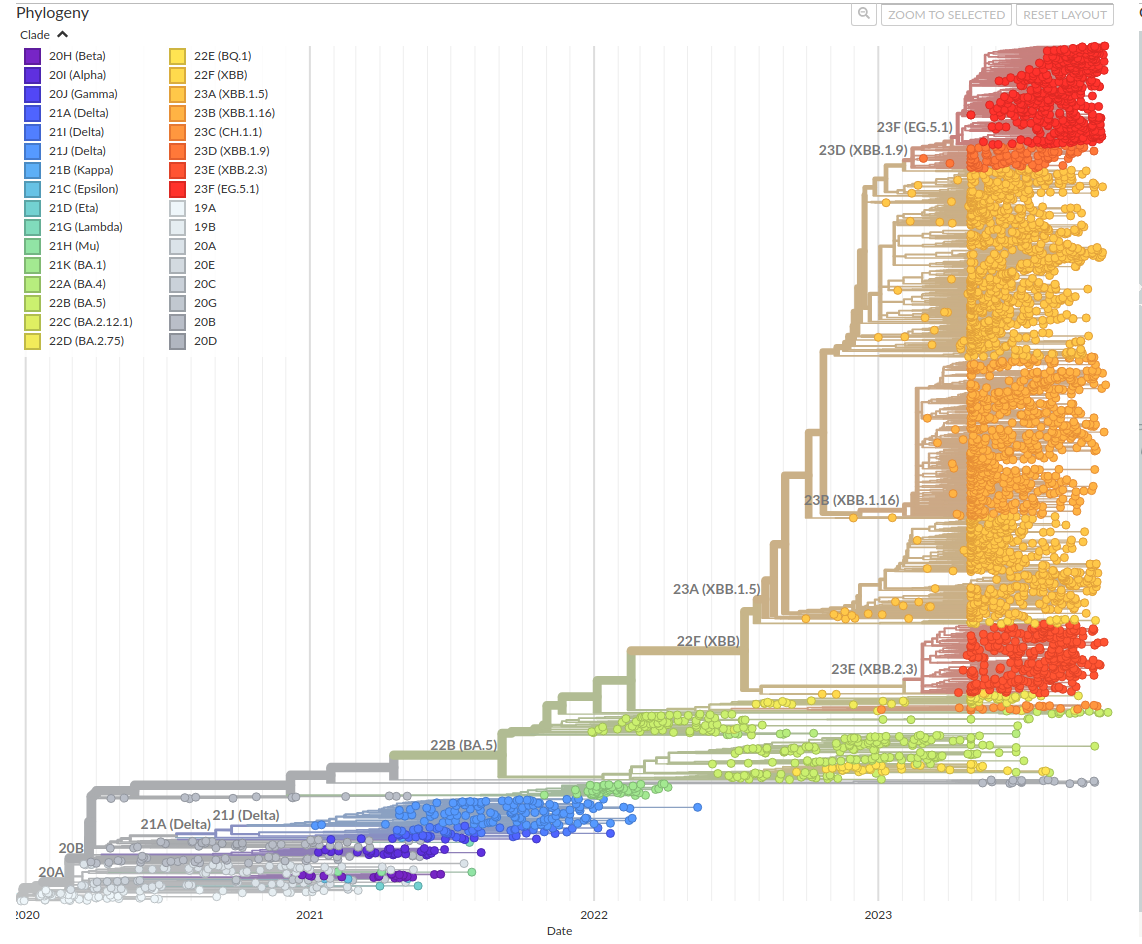
.right[https://nextstrain.org/ncov/gisaid/global/6m]
—
Covid-19, latest tree from NextStrain
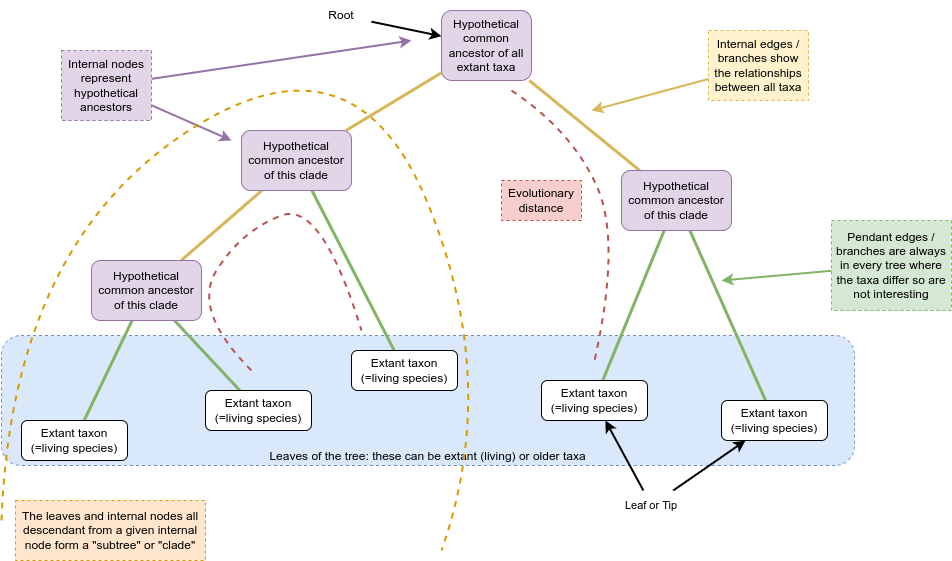
Terminology
Phylogenetic tree of hexapods
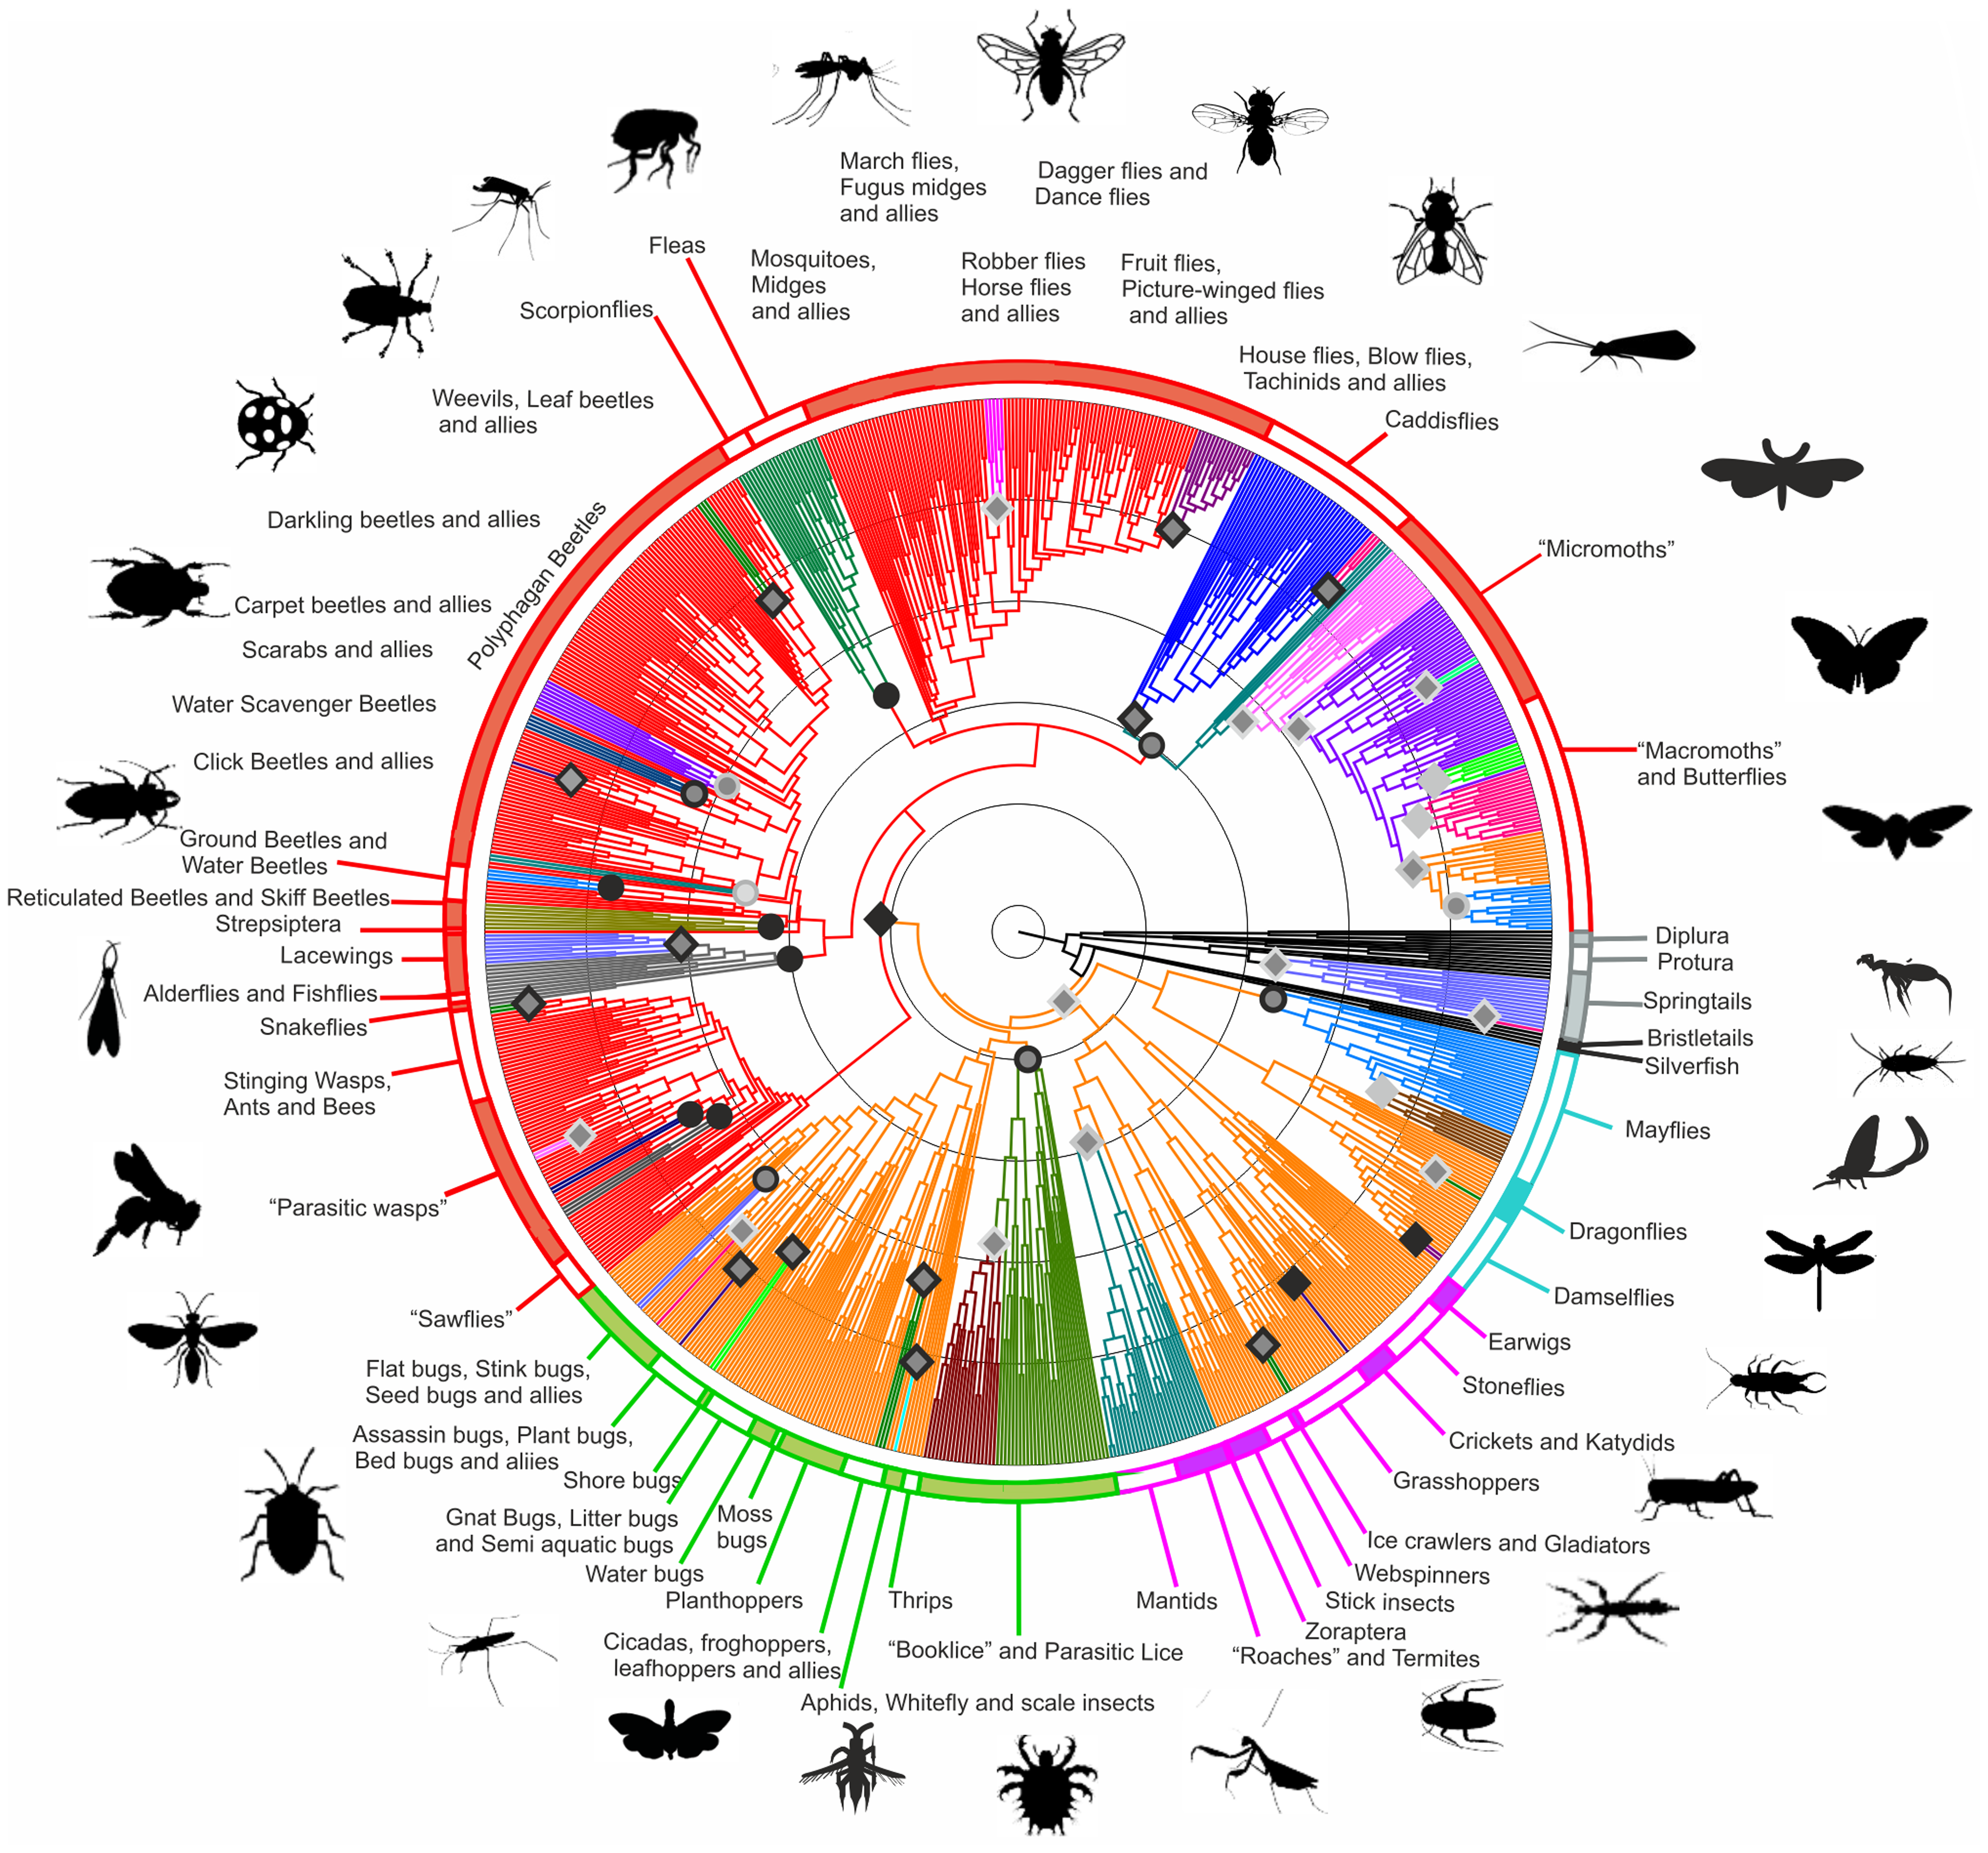 .left[https://doi.org/10.1371/journal.pone.0109085; CCBY 4.0 DEED license]
—
.left[https://doi.org/10.1371/journal.pone.0109085; CCBY 4.0 DEED license]
—
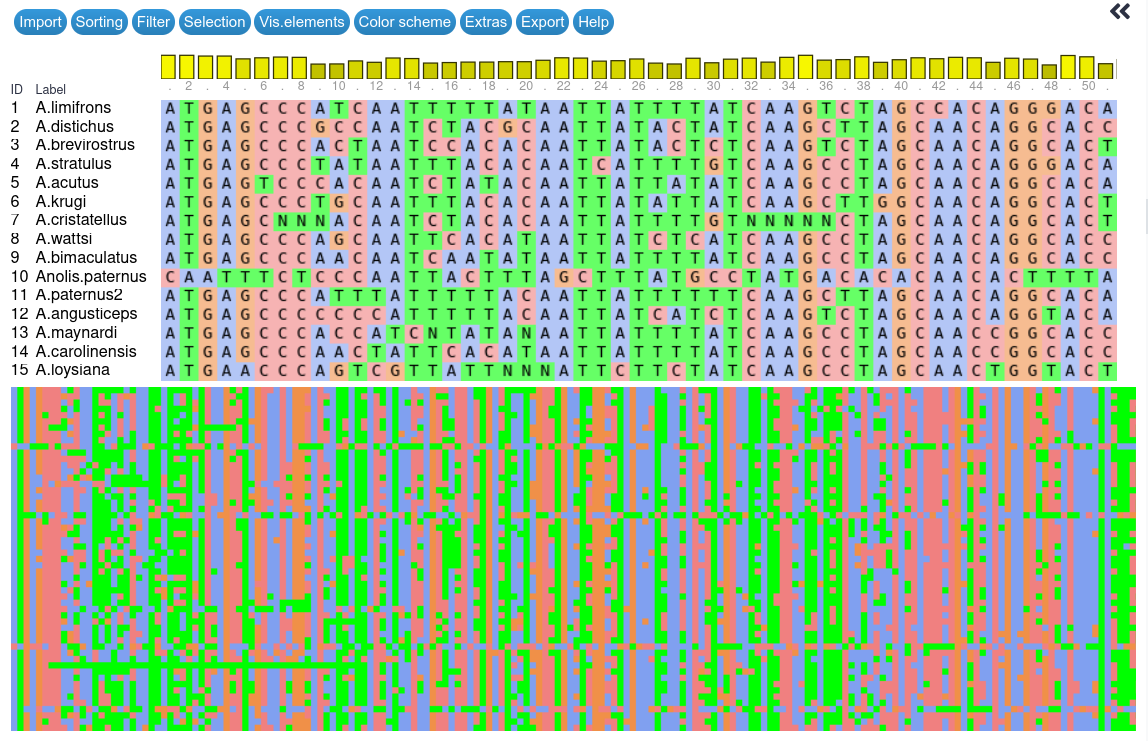
Sequence alignment
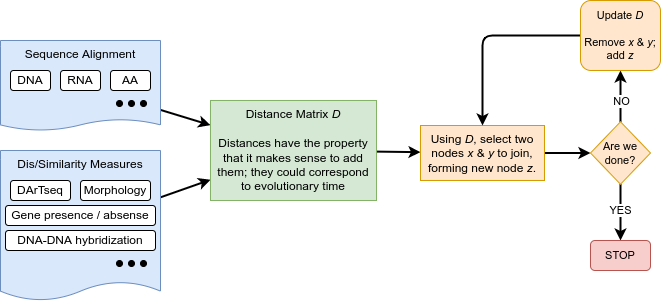
Building trees from distances
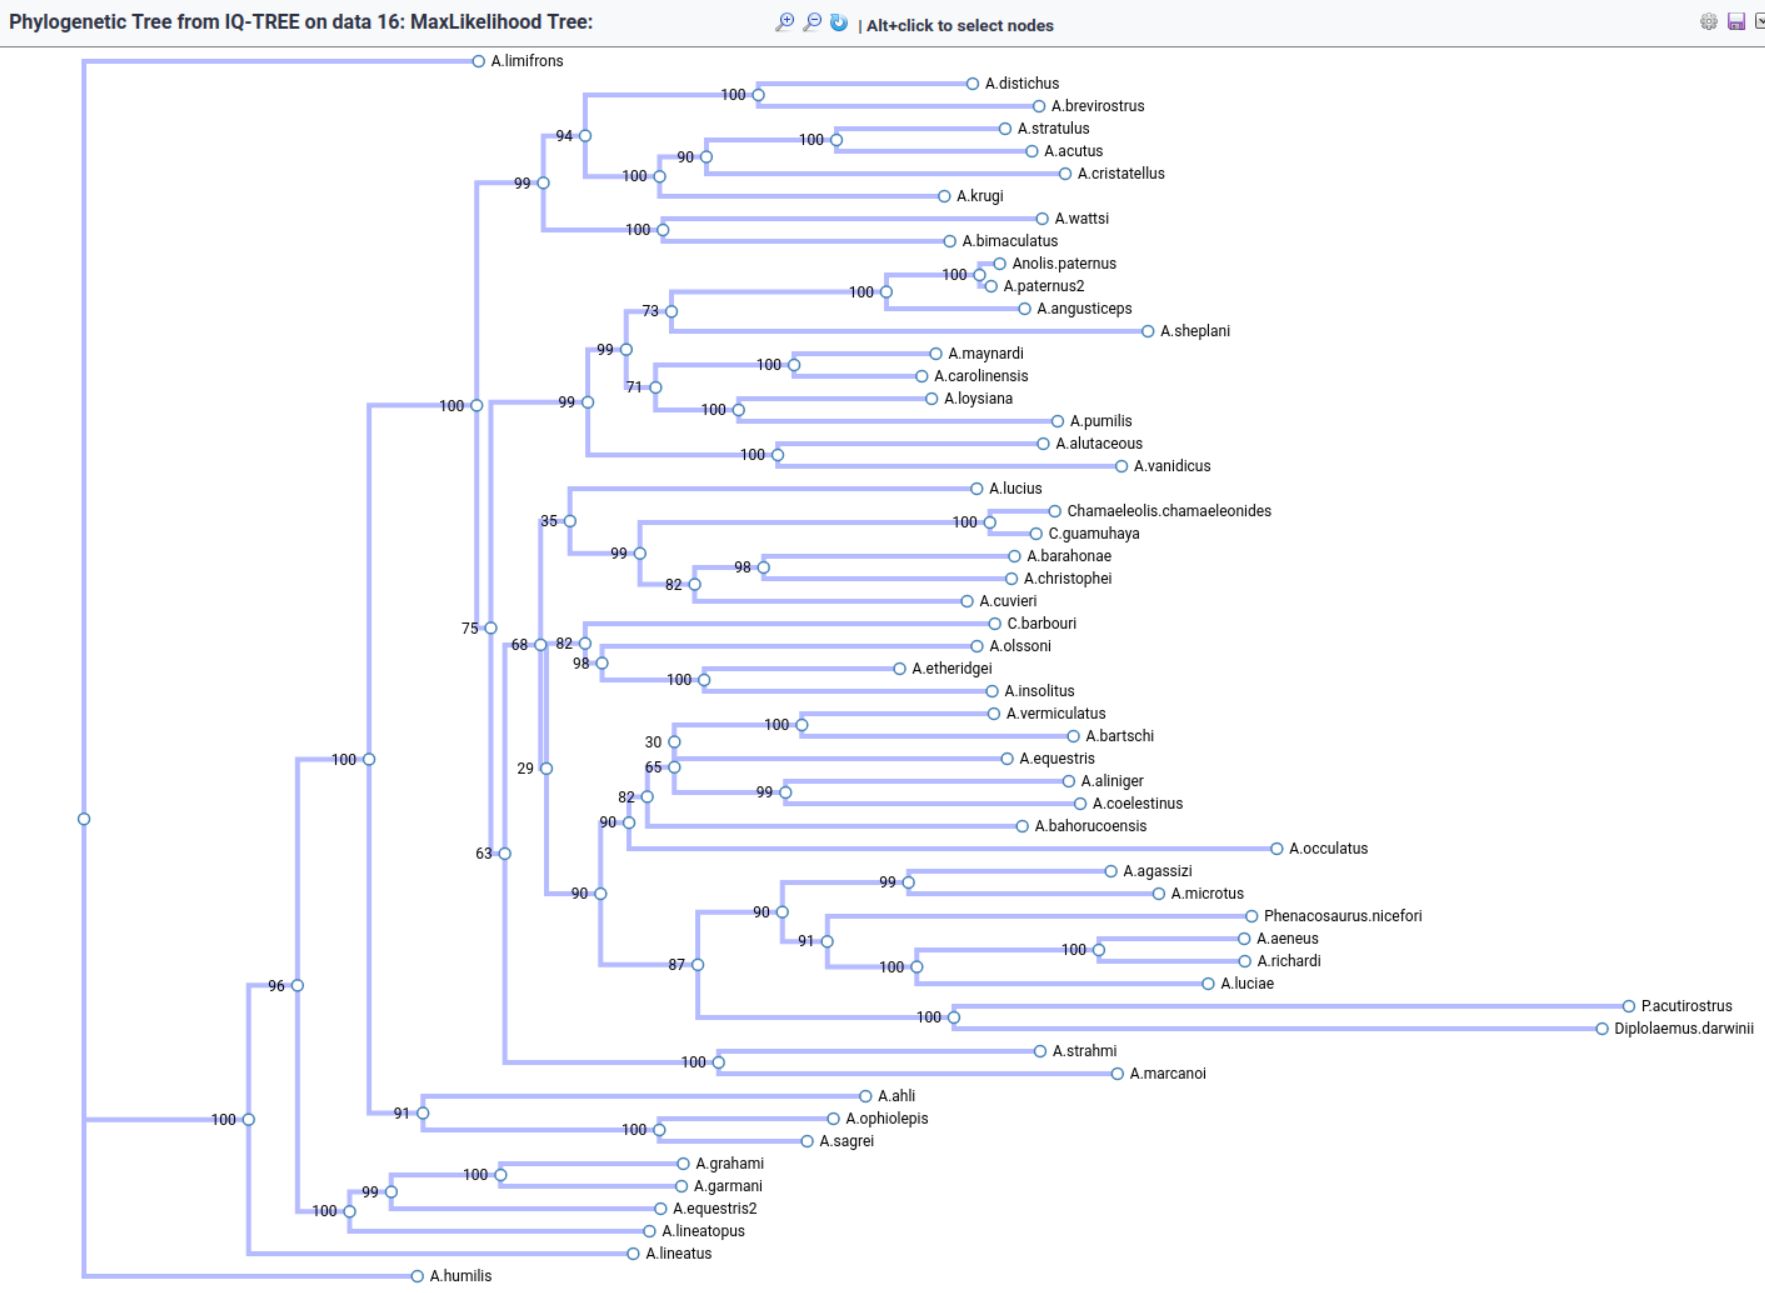
Searching for trees
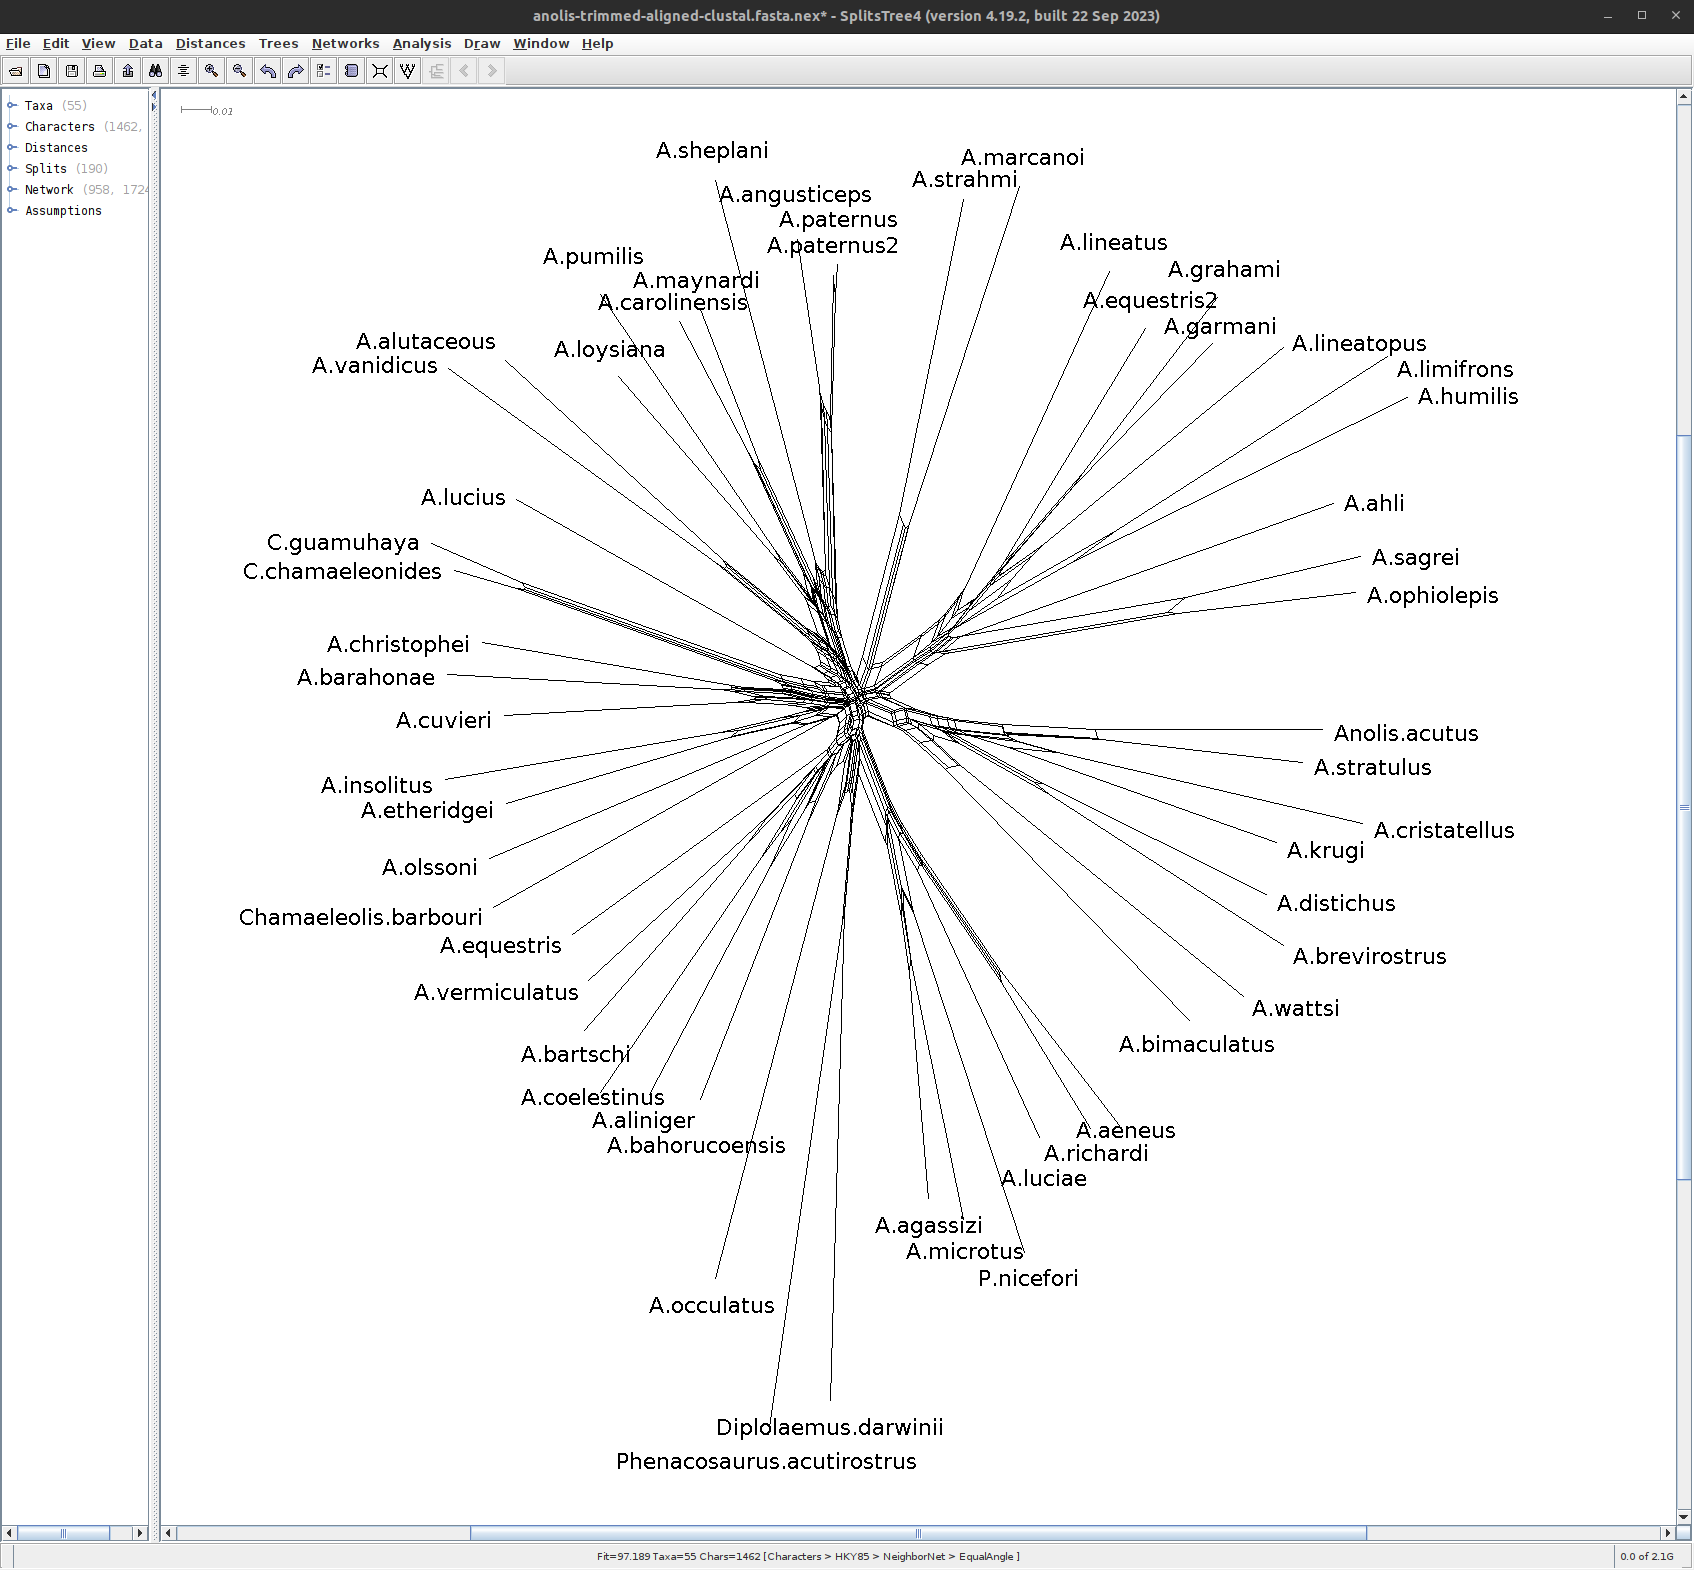
Phylogenetic Networks
Thank you!
Let’s begin
Thank you!
This material is the result of a collaborative work. Thanks to the Galaxy Training Network and all the contributors! Tutorial Content is licensed under
Creative Commons Attribution 4.0 International License.
Tutorial Content is licensed under
Creative Commons Attribution 4.0 International License.