Peptide Library Data Analysis
| Author(s) |
|
| Reviewers |
|
OverviewQuestions:
Objectives:
How to utilize quantitative properties of amino acids and peptide sequence to analyse peptide data?
Requirements:
Calculate descriptors
Quantitative analysis of peptide sequence properties
Time estimation: 20 minutesLevel: Intermediate IntermediateSupporting Materials:Published: Jan 22, 2021Last modification: Nov 9, 2023License: Tutorial Content is licensed under Creative Commons Attribution 4.0 International License. The GTN Framework is licensed under MITpurl PURL: https://gxy.io/GTN:T00227rating Rating: 4.0 (0 recent ratings, 1 all time)version Revision: 5
Several computational methods have been proven very useful in the initial screening and prediction of peptides for various biological properties. These methods have emerged as effective alternatives to the lengthy and expensive traditional experimental approaches. Properties associated with a group of peptide sequences such as overall charge, hydrophobicity profile, or k-mer composition can be utilized to compare peptide sequences and libraries. In this tutorial, we will be discussing how peptide-based properties like charge, hydrophobicity, the composition of amino acids, etc. can be utilized to analyze the biological properties of peptides. Additionally, we will learn how to use different utilities of the Peptide Design and Analysis Under Galaxy (PDAUG) package to calculate various peptide-based descriptors, and use these descriptors and feature spaces to build informative plots.
Easy access to tools, workflows and data from the docker image
An easy way to install and use the PDAUG toolset, and follow this tutorial is via a prebuilt docker image equipped with a PDAUG toolset, workflow, and data library. A prebuilds docker image can be downloaded and run by typing a simple command at the terminal after installing docker software on any operating system.
Hands On: Easy access of tools, workflows and data from docker image
- Downloading the docker image from the docker hub using
docker pull jayadevjoshi12/galaxy_pdaug:latestcommand.- Running the container with latest PDAUG tools
docker run -i -t -p 8080:80 jayadevjoshi12/galaxy_pdaug:latest.- Workflow is available under the workflow section, use
adminas username andpasswordas a password to login as an administrator of your galaxy instance.- Use
adminas username andpasswordas a password to login galaxy instance, which is available at localhost to access workflow and data.
AgendaIn this tutorial, we will cover:
Peptide Data
Several inbuilt data sets have been provided with the toolPDAUG Peptide Data Access. The antimicrobial peptides (AMPs) versus transmembrane peptides (TMPs) dataset was used as an example data set to understand the overall relation between features and biological properties of peptides. AMPs consist of an intersection of all activity annotations of the APD2 and CAMP databases, where gram-positive, gram-negative, and antifungal exact matches were observed. TMPs were extracted from alpha-helical transmembrane regions of proteins for classification.
Hands On: Fetching inbuild data
- PDAUG Peptide Data Access ( Galaxy version 0.1.0) with the following parameters:
- “Datasets”:
AMPvsTMP
Converting tabular data into fasta format
PDAUG Peptide Data Access tool returns data as a tabular file that contains sequences from both the classes. In order to utilize this data in the next steps, first we need to convert tabular data into fasta format. If data contains sequences from two different classes PDAUG TSVtoFASTA tool converts and splits data into two separate files for each of the class, AMPs, and TMPs. The reason behind converting and splitting the data is that all the downstream tools require two separate files if we are comparing two different peptide classes or calculating features.
Hands On: Converting tabular data into fasta formate
- PDAUG TSVtoFASTA ( Galaxy version 0.1.0) with the following parameters:
- param-file “Input file”:
PDAUG Peptide Data Access - AMPvsTMP (tabular)(output of PDAUG Peptide Data Access tool)- “Peptide Column”:
name- “Method to convert data”:
Split Data By Class Label- “Column with the class label”:
class label
Analyzing peptide libraries (AMPs and TMPs) based on features and feature space
Summary Plot for peptide libraries
In this step, we utilize PDAUG Peptide Sequence Analysis tool to compare peptide sequences based on hydrophobicity, hydrophobic movement, charge, amino acid fraction, and sequence length and create a summary plot.
Hands On: Generating a summary plot to assess peptide dataset
- PDAUG Peptide Sequence Analysis ( Galaxy version 0.1.0) with the following parameters:
- “Analysis options”:
Plot Summary
- param-file “First input file”:
PDAUG TSVtoFASTA on data 1 - first (fasta)(first output of PDAUG TSVtoFASTA tool)- param-file “Second input file”:
PDAUG TSVtoFASTA on data 1 - second (fasta)(second output of PDAUG TSVtoFASTA tool)- “first input file”:
TMPs- “Second input file”:
AMPsQuestionWhat can be concluded from the summary plot based on different properties?
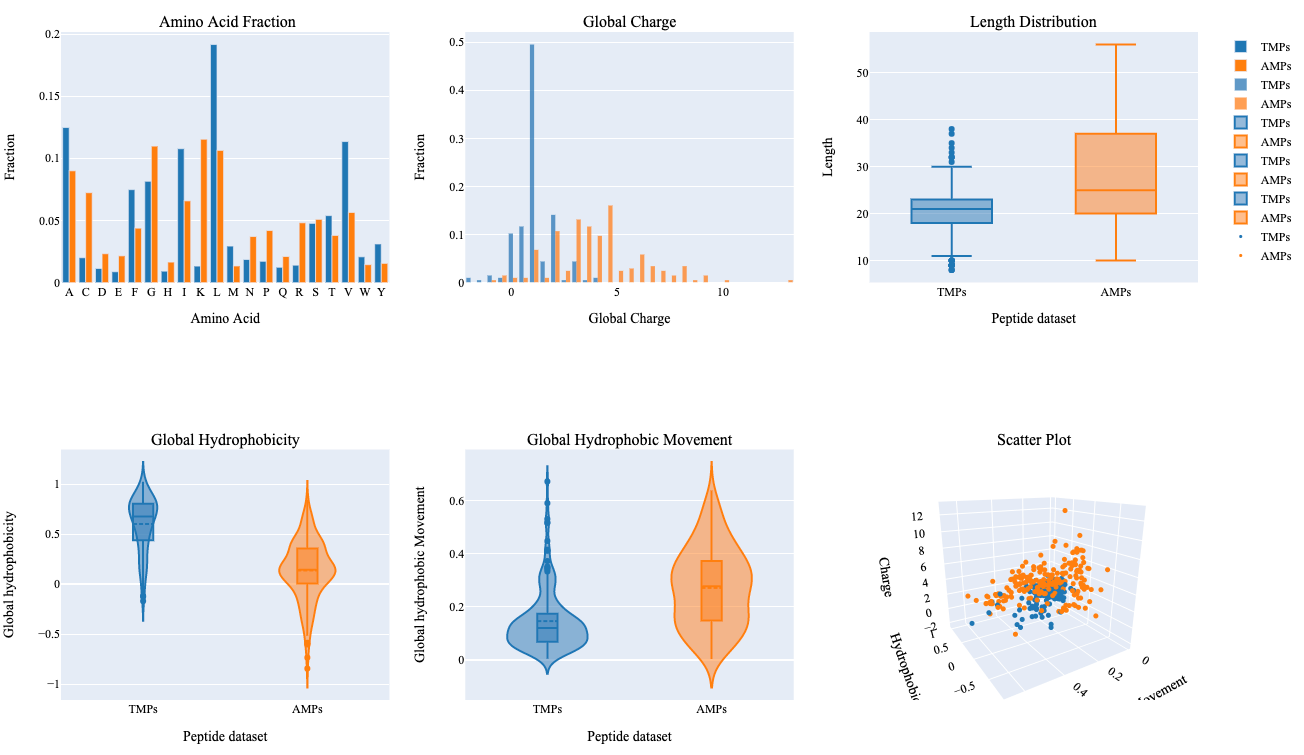
The summary plot represents differences between two sets of peptides based on an amino acid fraction, global charge, sequence length, global hydrophobicity, glocal hydrophobic movement. Additionally, 3D scattered plot shows the clustering of peptides based on three features.
- Leucine and Valine show relatively higher differences in terms of their fraction within both groups.
- TMPs show a global charge in the range of 0-5 in comparison to AMPs which show a global charge in a range of 0-14.
- AMPs show higher variability in terms of their length, global hydrophobic movement, and hydrophobicity in comparison to TMPs.
- Hydrophobic properties are important in determining transmembrane properties of proteins and peptides which is evident with this summary plot.
- Clustering of two different kinds of peptides can be observed with a 3D scattered plot based on their properties, however, we can also observe a few peptides with overlapping feature space.
 Open image in new tab
Assessing feature space distribution
In this tool, we have used PDAUG Fisher's Plot that compares two peptide libraries based on the feature space using the Fisher test.
Hands On: Generating a Fisher's plot to assess peptide dataset
- PDAUG Fisher’s Plot ( Galaxy version 0.1.0) with the following parameters:
- param-file “First fasta file”:
PDAUG TSVtoFASTA on data 1 - first (fasta)(first output of PDAUG TSVtoFASTA tool)- param-file “Second fasta file”:
PDAUG TSVtoFASTA on data 1 - second (fasta)(second output of PDAUG TSVtoFASTA tool)- “Label for first population”:
TMPs- “Label for second population”:
AMPsQuestionWhat does Fisher’s plot represents?
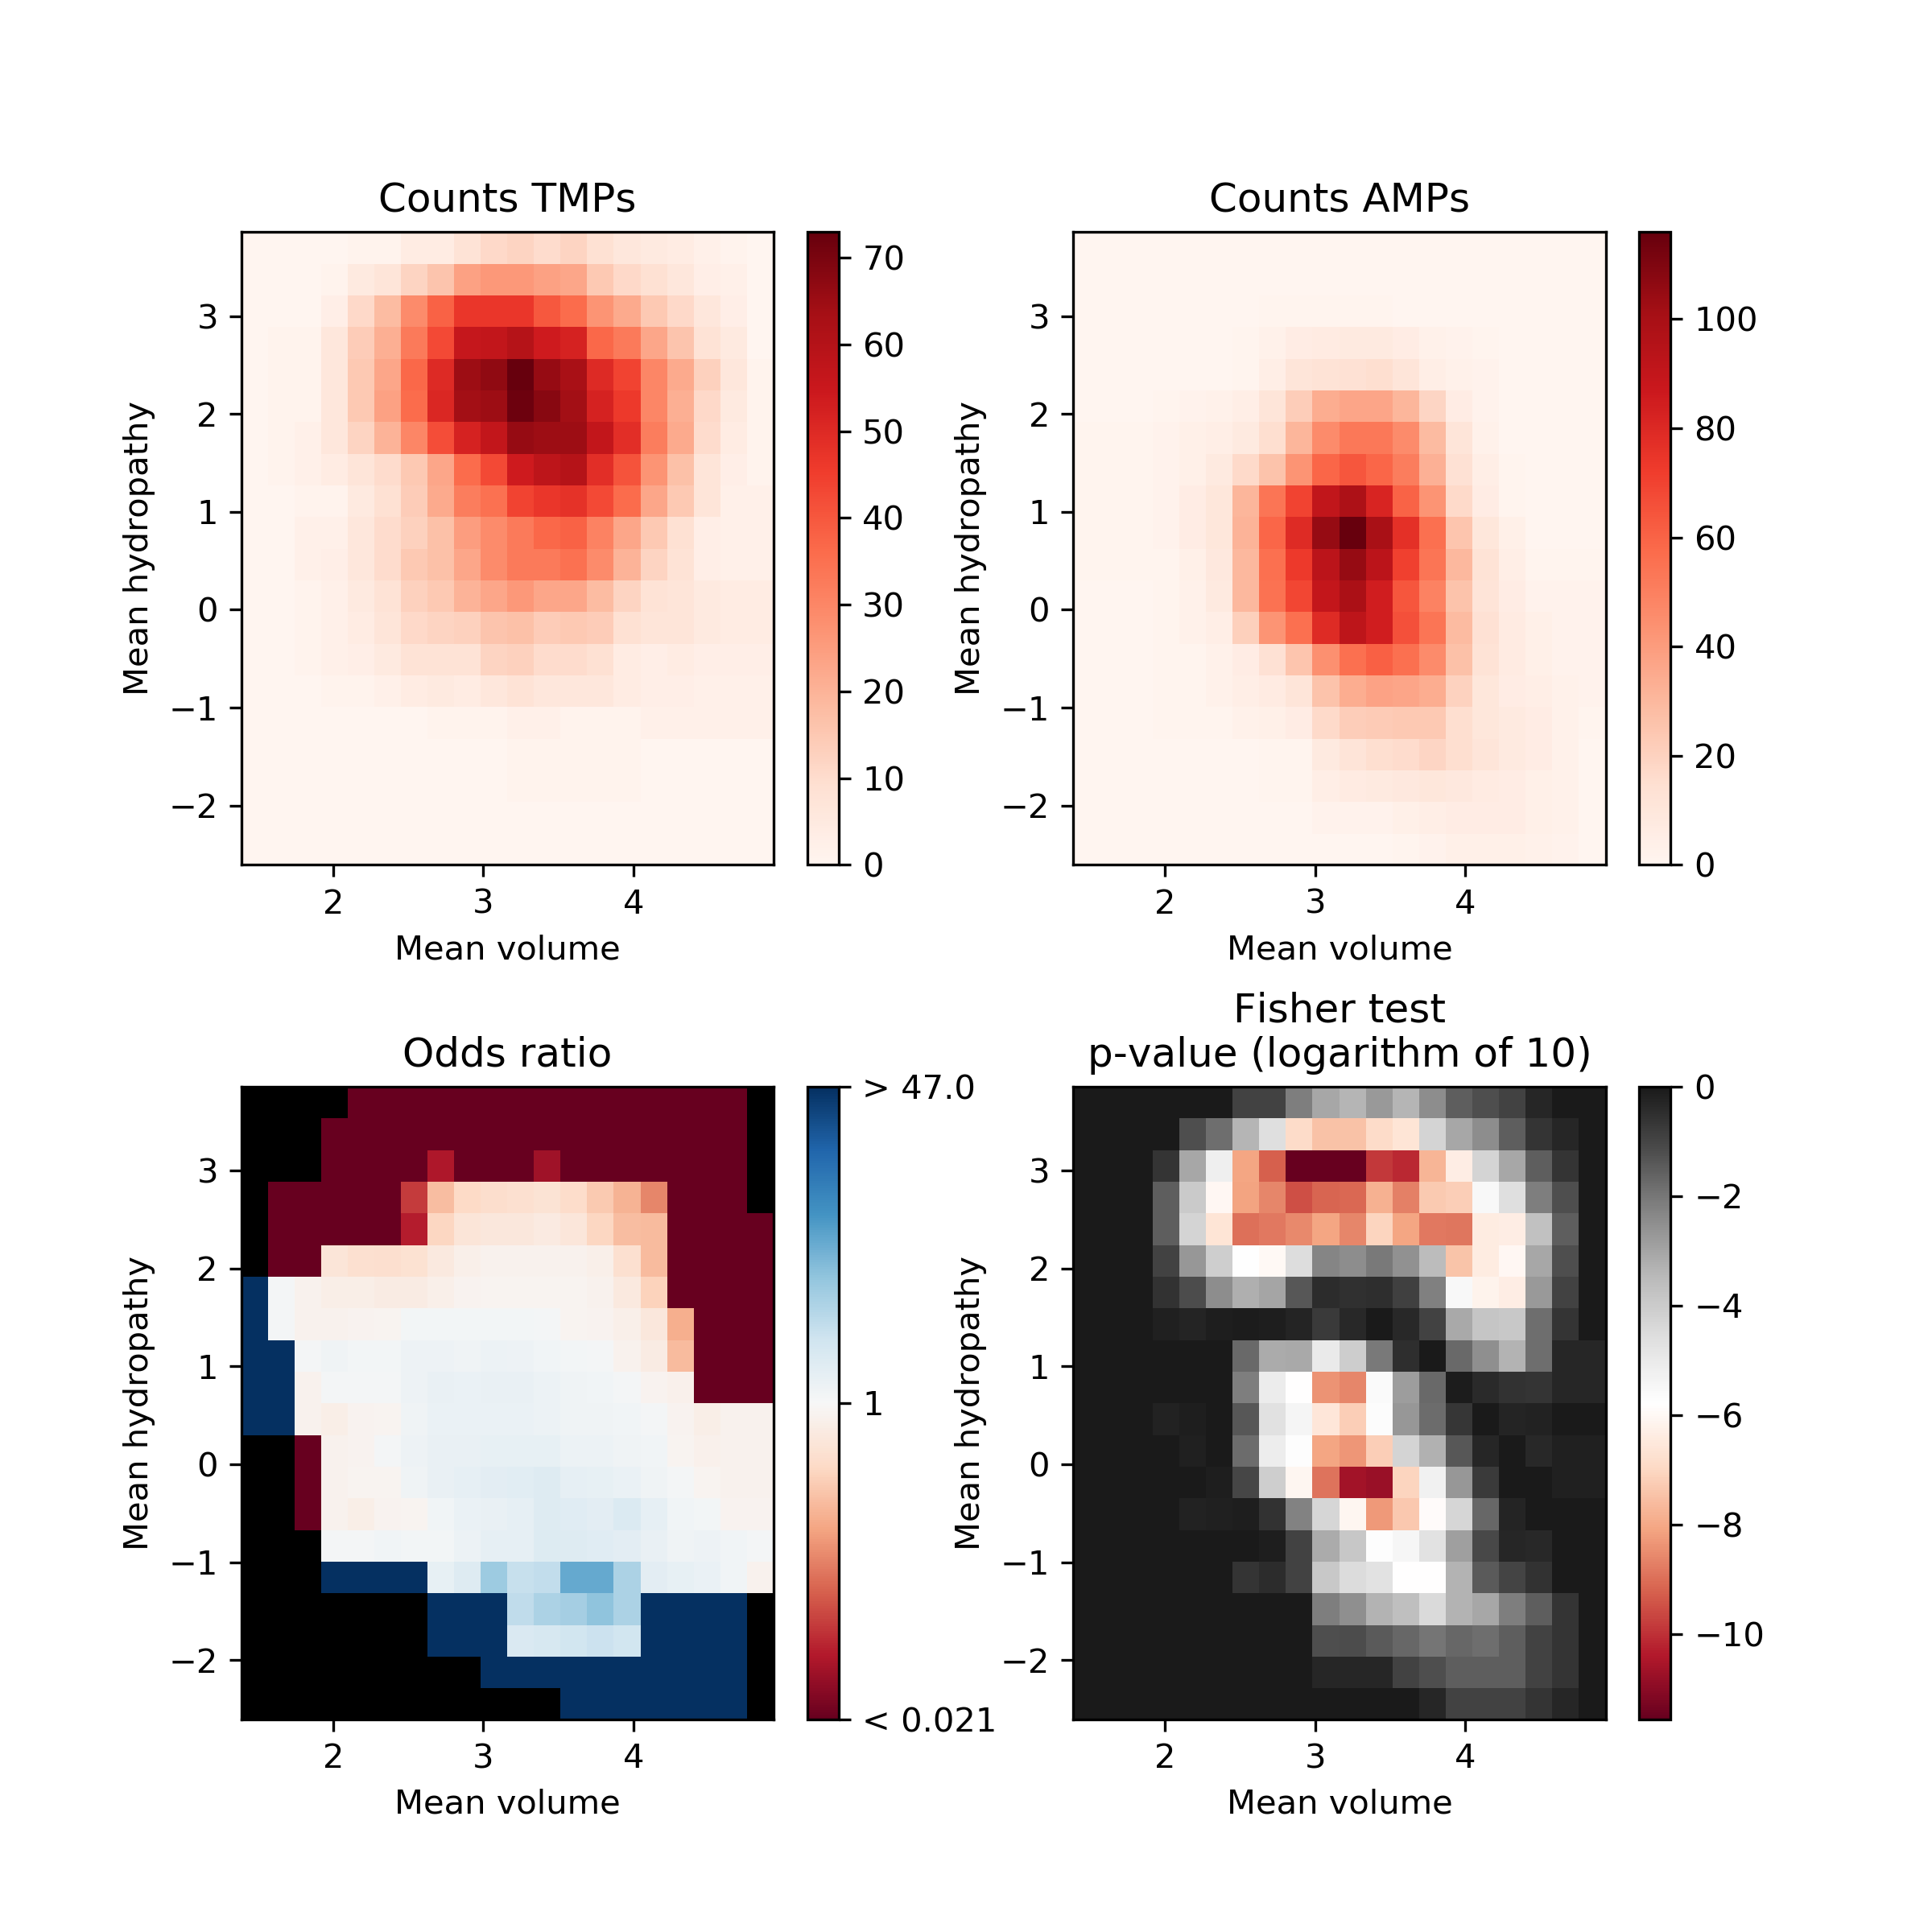
Fisher’s plot represents the difference between two groups of peptides based on their feature space. Each tiny square in this plot represents the feature space. Based on the sliding window Fisher’s test was performed for each feature space to assess the presence of peptides from two different groups on each of the tiny squares. The AMPs and TMPs in the feature space represented by their mean hydropathy and amino acid volume. Fisher’s plot shows that the sequences with larger hydrophobic amino acids are more frequent in TMPs in comparison to AMPs.
 Open image in new tab
The AMPs and TMPs in the feature space represented by their mean hydropathy and amino acid volume. Fisher’s plot shows that the sequences with larger hydrophobic amino acids are more frequent in TMPs in comparison to AMPs.
Assessing the relation between peptide features by 3D scatter plot
Calculating Sequence Property-Based Descriptors
In this step we will calculate Composition, Transition and Distribution (CTD) descriptos. Composition describptors are defined as the number of amino acids of a particular property divided by total number of amino acids. Transition descriptors are representd as the number of transition from a particular property to different property divided by (total number of amino acids − 1). Distribution descriptors are derived by chain length and the amino acids of a particular property located on this length Govindan and Nair 2013.
Hands On: Calculating descriptors for the peptide dataset
- PDAUG Sequence Property Based Descriptors ( Galaxy version 0.1.0) with the following parameters:
- param-file “Input fasta file”:
PDAUG TSVtoFASTA on data 1 - first (fasta)(first output of PDAUG TSVtoFASTA tool)- “Descriptor Type”:
CTD- PDAUG Sequence Property Based Descriptors ( Galaxy version 0.1.0) with the following parameters:
- param-file “Input fasta file”:
PDAUG TSVtoFASTA on data 1 - second (fasta)(second output of PDAUG TSVtoFASTA tool)- “Descriptor Type”:
CTD
Adding the Class Label in both AMPs and TMPs
Class labels or target labels usually represents the class of peptides. Here in our data set, we have peptides, either as AMP or TMP. Since we have two classes we can represent these two classes with their actual labels AMPs and TMPs.
- Adding Class Label (target labels) in AMPs and TMPs data
Hands On: Adding Class Labels (target labels) to the tabular data
- PDAUG Add Class Label ( Galaxy version 0.1.0) with the following parameters:
- param-file “Input file”:
PDAUG Sequence Property Based Descriptors on data 2 - CTD (tabular)(output of PDAUG Sequence Property Based Descriptors tool)- “Class Label”:
TMPs- PDAUG Add Class Label ( Galaxy version 0.1.0) with the following parameters:
- param-file “Input file”:
PDAUG Sequence Property Based Descriptors on data 3 - CTD (tabular)(output of PDAUG Sequence Property Based Descriptors tool)- “Class Label”:
AMPs
Merging the two tabular data files
We utilize PDAUG Merge Dataframes to merge two tabular data files.
Hands On: Merging two tabular data files
- PDAUG Merge Dataframes ( Galaxy version 0.1.0) with the following parameters:
- param-files “Input files”:
PDAUG Add Class Label on data 6 - (tabular)(output of PDAUG Add Class Label tool),PDAUG Add Class Label on data 7 - (tabular)(output of PDAUG Add Class Label tool)- “Option to merg data”:
Merge data without adding class label
Plotting CTD descriptor data as Scatter plot
Tool PDAUG Basic Plots will be used to compare two peptide libraries based on three CTD descriptors SecondaryStrD1100, SolventAccessibilityD2001, and NormalizedVDWVD3050 respectively. A 3D scatter plot will be generated.
Hands On: Generating a scatter plot to assess features
- PDAUG Basic Plots ( Galaxy version 0.1.0) with the following parameters:
- “Data plotting method”:
Scatter Plot
- param-file “Input file”:
PDAUG Merge Dataframes on data 9 and data 8 - (tabular)(output of PDAUG Merge Dataframes tool)- “Scatter Plot type”:
3D
- “First feature”:
_SecondaryStrD1100- “Second feature”:
_SolventAccessibilityD2001- “Third feature”:
_NormalizedVDWVD3050- “Class label column”:
Class_label
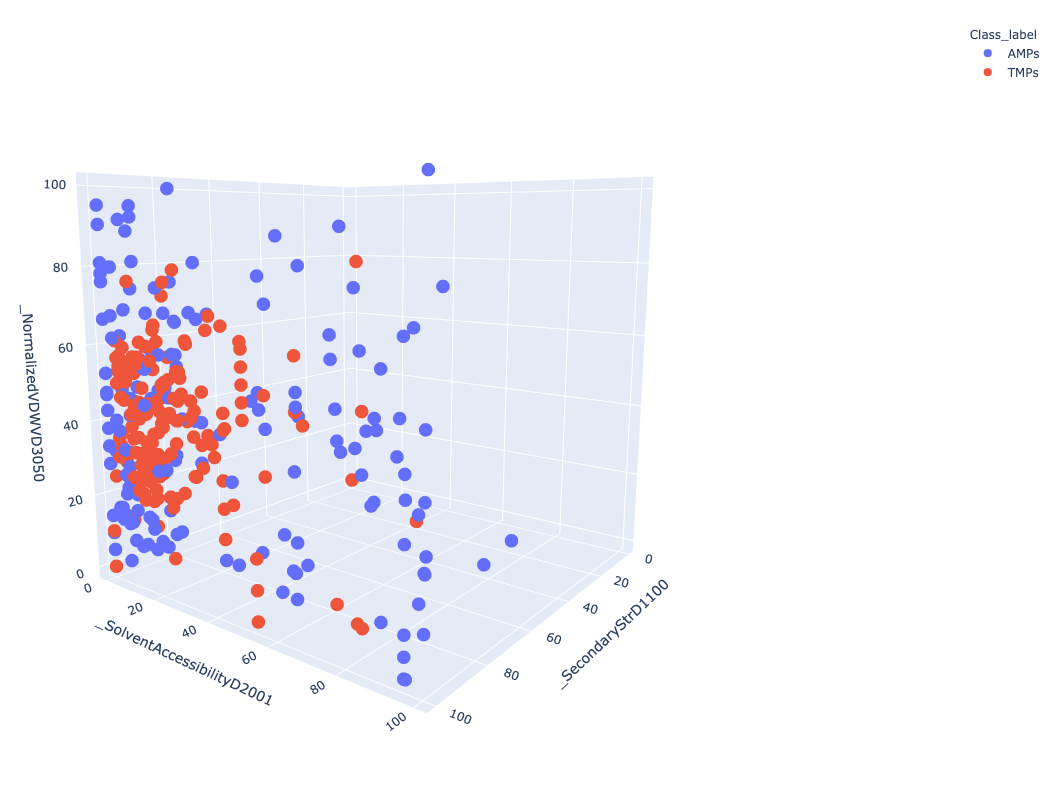 Open image in new tab
Figure 3 Represent 3D scattered plot generated based on the CTD descriptors. Red dots represent TMPs and blue dots represent AMPs. Based on these 3 features, we can observe that both groups do not show any clear separation or cluster in the 3D space.
In this tutorial, we learned how to utilize inbuild data, calculate features, and utilize descriptors or features to assess biological properties. We also learned how to utilize various utilities of PDAUG to generate useful plots to include in our peptide research.
Conclusion
In this tutorial, we learned an example flexible and extensible analysis of peptide data using PDAUG tools. We generated various plots based on the quantitative properties of amino acids and peptide sequences.
 Open image in new tab
You've Finished the Tutorial
Frequently Asked Questions
Have questions about this tutorial? Have a look at the available FAQ pages and support channelsUseful literature
Further information, including links to documentation and original publications, regarding the tools, analysis techniques and the interpretation of results described in this tutorial can be found here.
References
- Govindan, G., and A. S. Nair, 2013 Bagging with CTD – A Novel Signature for the Hierarchical Prediction of Secreted Protein Trafficking in Eukaryotes. Genomics, Proteomics & Bioinformatics 11: 385–390. 10.1016/j.gpb.2013.07.005
Feedback
Did you use this material as an instructor? Feel free to give us feedback on how it went.
Did you use this material as a learner or student? Click the form below to leave feedback.

Citing this Tutorial
- Jayadev Joshi, Daniel Blankenberg, Peptide Library Data Analysis (Galaxy Training Materials). https://training.galaxyproject.org/training-material/topics/proteomics/tutorials/peptide-library-data-analysis/tutorial.html Online; accessed TODAY
- Hiltemann, Saskia, Rasche, Helena et al., 2023 Galaxy Training: A Powerful Framework for Teaching! PLOS Computational Biology 10.1371/journal.pcbi.1010752
- Batut et al., 2018 Community-Driven Data Analysis Training for Biology Cell Systems 10.1016/j.cels.2018.05.012
Congratulations on successfully completing this tutorial!@misc{proteomics-peptide-library-data-analysis, author = "Jayadev Joshi and Daniel Blankenberg", title = "Peptide Library Data Analysis (Galaxy Training Materials)", year = "", month = "", day = "", url = "\url{https://training.galaxyproject.org/training-material/topics/proteomics/tutorials/peptide-library-data-analysis/tutorial.html}", note = "[Online; accessed TODAY]" } @article{Hiltemann_2023, doi = {10.1371/journal.pcbi.1010752}, url = {https://doi.org/10.1371%2Fjournal.pcbi.1010752}, year = 2023, month = {jan}, publisher = {Public Library of Science ({PLoS})}, volume = {19}, number = {1}, pages = {e1010752}, author = {Saskia Hiltemann and Helena Rasche and Simon Gladman and Hans-Rudolf Hotz and Delphine Larivi{\`{e}}re and Daniel Blankenberg and Pratik D. Jagtap and Thomas Wollmann and Anthony Bretaudeau and Nadia Gou{\'{e}} and Timothy J. Griffin and Coline Royaux and Yvan Le Bras and Subina Mehta and Anna Syme and Frederik Coppens and Bert Droesbeke and Nicola Soranzo and Wendi Bacon and Fotis Psomopoulos and Crist{\'{o}}bal Gallardo-Alba and John Davis and Melanie Christine Föll and Matthias Fahrner and Maria A. Doyle and Beatriz Serrano-Solano and Anne Claire Fouilloux and Peter van Heusden and Wolfgang Maier and Dave Clements and Florian Heyl and Björn Grüning and B{\'{e}}r{\'{e}}nice Batut and}, editor = {Francis Ouellette}, title = {Galaxy Training: A powerful framework for teaching!}, journal = {PLoS Comput Biol} }
You can use Ephemeris's
shed-tools installcommand to install the tools used in this tutorial.shed-tools install [-g GALAXY] [-a API_KEY] -t <(curl https://training.galaxyproject.org/training-material/api/topics/proteomics/tutorials/peptide-library-data-analysis/tutorial.json | jq .admin_install_yaml -r)Alternatively you can copy and paste the following YAML
---
install_tool_dependencies: true
install_repository_dependencies: true
install_resolver_dependencies: true
tools:
- name: pdaug_addclasslabel
  owner: jay
  revisions: 7160bfd77aef
  tool_panel_section_label: Proteomics
  tool_shed_url: https://toolshed.g2.bx.psu.edu/
- name: pdaug_basic_plots
  owner: jay
  revisions: 15b6eec94c40
  tool_panel_section_label: Proteomics
  tool_shed_url: https://toolshed.g2.bx.psu.edu/
- name: pdaug_fishers_plot
  owner: jay
  revisions: 2fe62dfbdc9d
  tool_panel_section_label: Proteomics
  tool_shed_url: https://toolshed.g2.bx.psu.edu/
- name: pdaug_merge_dataframes
  owner: jay
  revisions: 2dbfb42d34bc
  tool_panel_section_label: Proteomics
  tool_shed_url: https://toolshed.g2.bx.psu.edu/
- name: pdaug_peptide_data_access
  owner: jay
  revisions: 7cf1e907c31d
  tool_panel_section_label: Proteomics
  tool_shed_url: https://toolshed.g2.bx.psu.edu/
- name: pdaug_peptide_sequence_analysis
  owner: jay
  revisions: 90e3b1968ae6
  tool_panel_section_label: Proteomics
  tool_shed_url: https://toolshed.g2.bx.psu.edu/
- name: pdaug_sequence_property_based_descriptors
  owner: jay
  revisions: 187c6f2d3b55
  tool_panel_section_label: Proteomics
  tool_shed_url: https://toolshed.g2.bx.psu.edu/
- name: pdaug_tsvtofasta
  owner: jay
  revisions: 03f954dd8360
  tool_panel_section_label: Proteomics
  tool_shed_url: https://toolshed.g2.bx.psu.edu/