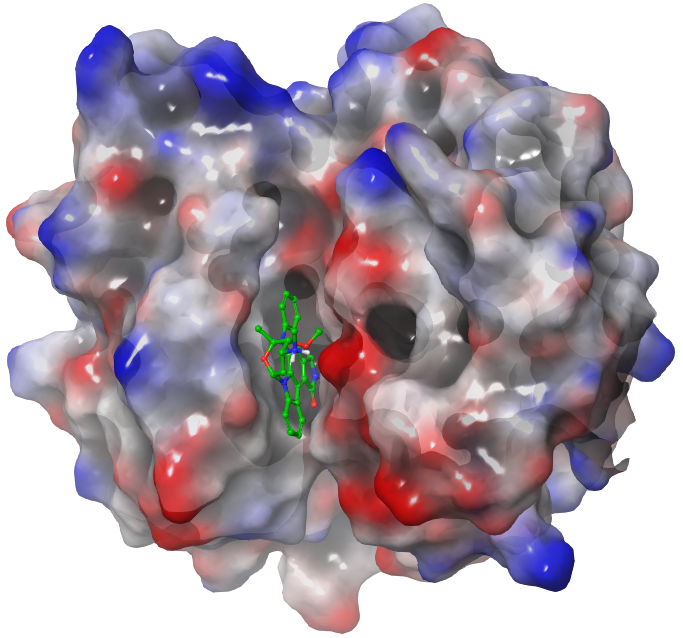
Historically, the pharmacophore concept was formulated in 1909 by the German physician and Nobel prize laureate Paul Ehrlich (Ehrlich 1909). According to the International Union of Pure and Applied Chemistry (IUPAC), a pharmacophore is defined as “an ensemble of steric and electronic features that is necessary to ensure the optimal supramolecular interactions with a specific biological target and to trigger (or block) its biological response” (Wermuth et al. 1998). Starting from the cocrystal structure of a non-covalent protein–ligand complex (e.g. Figure 1), pharmacophore perception involves the extraction of the key molecular features of the bioactive ligand at the protein–ligand contact interface into a single model (Moumbock et al. 2019). These pharmacophoric features mainly include: H-bond acceptor (HACC or A), H-bond donor (HDON or D), lipophilic group (LIPO or H), negative center (NEGC or N), positive center (POSC or P), and aromatic ring (AROM or R) moieties. Moreover, receptor-based excluded spheres (EXCL) can be added in order to mimic spatial constraints of the binding pocket (Figure 2). Once a pharmacophore model has been generated, a query can be performed either in a forward manner, using several ligands to search for novel putative hits of a given target, or in a reverse manner, by screening a single ligand against multiple pharmacophore models in search of putative protein targets (Steindl et al. 2006).
Figure 1: Crystal Structure of *Plasmodium falciparum* calcium-dependent protein kinase 2 (CDPK2) complexed with staurosporine (STU) with PDB ID: [4MVF](https://www.rcsb.org/structure/4mvf). Image generated using Maestro (Schrödinger LLC, NY).
Bioactive compounds often bind to several target proteins, thereby exhibiting polypharmacology. However, experimentally determining these interactions is laborious, and structure-based virtual screening of bioactive compounds could expedite drug discovery by prioritizing hits for experimental validation. The recently reported ePharmaLib (Moumbock et al. 2021) dataset is a library of 15,148 e-pharmacophores modeled from solved structures of pharmaceutically relevant protein–ligand complexes of the screening Protein Data Bank (sc-PDB, Desaphy et al. 2014). ePharmaLib can be used for target fishing of phenotypic hits, side effect predictions, drug repurposing, and scaffold hopping.
Figure 2: Depiction of the 2D structure of staurosporine (left) and 3D structure (right) with key pharmacophoric features extracted from the STU–CDPK2 complex (PDB ID: [4MVF](https://www.rcsb.org/structure/4mvf)). Image generated using Maestro (Schrödinger LLC, NY).
In this tutorial, you will perform pharmacophore-based target prediction of a bioactive ligand known as staurosporine (Figure 2) with the ePharmaLib subset representing Plasmodium falciparum protein targets (138 pharmacophore models) and the open-source pharmacophore alignment program Align-it, formerly known as PHARAO (Taminau et al. 2008).
Staurosporine (PDB hetID: STU) is an indolocarbazole secondary metabolite isolated from several bacteria of the genus Streptomyces. It displays diverse biological activities such as anticancer and antiparasitic activities (Nakano and Ōmura 2009).
As a first step, we create a new history for the analysis.
Hands On: Hands-on 1: Create history
Create a new history.
To create a new history simply click the new-history icon at the top of the history panel:
Rename it to Staurosporine target prediction.
Click on galaxy-pencil (Edit) next to the history name (which by default is “Unnamed history”)
Type the new name: Staurosporine target prediction
Click on Save
To cancel renaming, click the galaxy-undo “Cancel” button
If you do not have the galaxy-pencil (Edit) next to the history name (which can be the case if you are using an older version of Galaxy) do the following:
Click on Unnamed history (or the current name of the history) (Click to rename history) at the top of your history panel
Type the new name: Staurosporine target prediction
Press Enter
Get data
For this exercise, we need two datasets: the ePharmaLib pharmacophore library (PHAR format) and a query ligand structure file (SMI format).
Fetching the ePharmaLib dataset
Firstly, we will retrieve the concatenated ePharmaLib subset representing P. falciparum protein targets.
Hands On: Hands-on 2: Upload ePharmaLib
Upload the dataset from the Zenodo link provided to your Galaxy history.
Copy the link location
Click galaxy-uploadUpload at the top of the activity panel
Two versions of the ePharmaLib (PHAR & PHYPO formats) have been created for use with the pharmacophore alignment programs Align-it and Phase, respectively. Both versions can be broken down into small datasets. e.g. for human targets. They are freely available at Zenodo under the link:
https://zenodo.org/record/6055897
Change the datatype from tabularto phar. This step is essential, as Galaxy does not automatically detect the datatype for PHAR files.
Click on the galaxy-pencilpencil icon for the dataset to edit its attributes
In the central panel, click galaxy-chart-select-dataDatatypes tab on the top
In the galaxy-chart-select-dataAssign Datatype, select phar from “New Type” dropdown
Tip: you can start typing the datatype into the field to filter the dropdown menu
Click the Save button
You can view the contents of the downloaded PHAR file by pressing the eye icon (View data) for this dataset.
A PHAR file is essentially a series of lines containing the three-dimensional coordinates of pharmacophoric features and excluded spheres. The first column specifies a feature type (e.g. HACC is a hydrogen bond acceptor). Subsequent columns specify the position of the feature center in a three-dimensional space. Individual pharmacophores are separated by lines containing four dollar signs ($$$$). The pharmacophores of the ePharmaLib dataset were labeled according to the following three-component code PDBID-hetID-UniprotEntryName.
Creating a query ligand structure file
In this step, we will manually create an SMI file containing the SMILES of staurosporine.
The simplified molecular-input line-entry system (SMILES) is a string notation for describing the 2D chemical structure of a compound. It only states the atoms present in a compound and the connectivity between them. As an example, the SMILES string of acetone is CC(=O)C. SMILES strings can be imported by most molecule editors and converted into either two-dimensional structural drawings or three-dimensional models of the compounds, and vice versa. For more information on how the notation works, please consult the OpenSMILES specification or the description provided by Wikipedia.
Hands On: Hands-on 3: Create an SMI file
Create a new file using the Galaxy upload manager, with the following contents. Make sure to select the datatype (with Type) as smi. This step is essential, as Galaxy does not automatically detect the datatype for SMI files.
Click galaxy-uploadUpload Data at the top of the tool panel
Select galaxy-wf-editPaste/Fetch Data at the bottom
Paste the file contents into the text field
Change Type from “Auto-detect” to smi* Press Start and Close the window
A SMILES string can automatically be generated from a ligand name or 2D structure with a desktop molecule editor such ChemDraw® and Marvin®, or with web-based molecule editors such as PubChem Sketcher and ChemDraw® JS. Moreover, the pre-computed SMILES strings of a large number of bioactive compounds can be retrieved from chemical databases such as PubChem. e.g.
Why do we specifically use a so-called isomeric SMILES string?
Staurosporine is a chiral molecule possessing four chiral centers. The SMILES notation allows the specification of configuration at tetrahedral centers and double bond geometry, by marking atoms with @ or @@. These are structural features that cannot be specified by connectivity alone, and therefore SMILES which encode this information are termed isomeric SMILES. A notable feature of these rules is that they allow rigorous partial specification of chirality.
Pre-processing
Prior to pharmacophore alignment, the predominant ionization state(s) of the query ligand as well as its 3D conformers should be generated. Also, the pharmacophore dataset will be split into a collection of individual pharmacophore files.
Ligand hydration
More often than not, the bioactive form of a compound is its predominant form at physiological pH (7.4). In this step, we predict the most probable ionization state(s) of the query ligand at pH 7.4 with the cheminformatics toolkit OpenBabel (O’Boyle et al. 2011).
Hands On: Hands-on 4: Add hydrogen atoms
Add hydrogen atoms ( Galaxy version 3.1.1+galaxy1) with the following parameters:
“Add hydrogens to polar atoms only (i.e. not to carbon atoms)”: Yes
Rename the output to staurosporine_hydrated.
Click on the galaxy-pencilpencil icon for the dataset to edit its attributes
In the central panel, change the Name field to staurosporine_hydrated
Click the Save button
Question
Nitrogen-containing functional groups are known to be basic. Which of them present in staurosporine (Figure 2) do you expect to be protonated at pH 7.4, and which not? And why?
Only the secondary N-methylamino group will be protonated because indoles, much like aromatic amides, are typically not basic.
Splitting ePharmaLib into individual pharmacophores
The ePharmaLib subset representing P. falciparum protein targets (ePharmaLib_PHARAO_plasmodium.phar) is a concatenated file containing 148 individual pharmacophore files. To speed up our analysis, it is preferable to split the dataset into individual files in order to perform several pharmacophore alignments in parallel, using Galaxy’s collection functionality.
Hands On: Hands-on 5: Splitting ePharmaLib
Split file ( Galaxy version 0.5.0) with the following parameters:
“Select the file type to split”: Generic
param-file“File to split”: ePharmaLib_PHARAO_plasmodium.phar (from Hands-on 2)
“Method to split files”: Specify record separator as regular expression
“Regex to match record separator”: \$\$\$\$
“Split records before or after the separator?”: After
“Specify number of output files or number of records per file?”: Number of records per file ('chunk mode')
“Base name for new files in collection”: epharmalib
“Method to allocate records to new files”: Maintain record order
Rename the output to ePharmaLib_PLAF_split.
Click on the galaxy-pencilpencil icon for the dataset to edit its attributes
In the central panel, change the Name field to ePharmaLib_PLAF_split
Click the Save button
Ligand conformational flexibility
To reduce the calculation time, the Align-it (Taminau et al. 2008) tool performs rigid alignment rather than flexible alignment. Conformational flexibility of the ligand is accounted for by introducing a preliminary step, in which a set of energy-minimized conformers for the query ligand are generated with the RDConf (Koes) tool (using the RDKit (Landrum and others 2013) toolkit).
Hands On: Hands-on 6: Low-energy ligand conformer search
RDConf: Low-energy ligand conformer search ( Galaxy version 2020.03.4+galaxy0) with the following parameters:
“Maximum number of conformers to generate per molecule”: 100
Rename the output to staurosporine_3D_conformers.
Click on the galaxy-pencilpencil icon for the dataset to edit its attributes
In the central panel, change the Name field to staurosporine_3D_conformers
Click the Save button
Comment: RDConf
It is recommended to use the default settings, except for the number of conformers which should be changed to 100. As a rule of thumb, a threshold of 100 conformers appropriately represents the conformational flexibility of a compound with less than 10 rotatable bonds. The output SDF (structure data file) format encodes three-dimensional atomic coordinates of each conformer, separated by lines containing four dollar signs ($$$$).
Question
Have a look at the contents of the created collection staurosporine_3D_conformers. Why were less than 100 conformers were generated for staurosporine?
Staurosporine is a fused 8-ring system with only two rotatable bonds, due to its planar aromatic 5-ring indolocarbozole scaffold which confers a high structural rigidity upon the compound, i.e. it exists in relatively few energetically distinct 3D conformations.
Pharmacophore alignment
In this step, the ligand conformer dataset (SDF format) is converted on-the-fly to a pharmacophore dataset (PHAR format) and simultaneously aligned to the individual pharmacophores of the ePharmaLib dataset in a batch mode with Align-it (Taminau et al. 2008). The pharmacophoric alignments and thus the predicted targets are ranked in terms of a scoring metric: Tversky index = [0,1]. The higher the Tversky index, the higher the likelihood of the predicted protein–ligand interaction.
Hands On: Hands-on 7: Pharmacophore alignment
Pharmacophore alignment ( Galaxy version 1.0.4+galaxy0) with the following parameters:
param-file“Defines the database of molecules that will be used to screen”: staurosporine_3D_conformers (from Hands-on 7)
“No normal information is included during the alignment”: Yes
“Disable the use of hybrid pharmacophore points”: Yes
“Only structures with a score larger than this cutoff will be written to the files”: 0.0
“Maximum number of best scoring structures to write to the files”: 1
“This option defines the used scoring scheme”: TVERSKY_REF
Post-processing
The above pharmacophore alignment produces three types of outputs: the aligned pharmacophores (PHAR format), aligned structures (SMI format), and alignment scores (tabular format). Of these results, only the alignment scores are of interest and will be post-processed prior to analysis.
Concatenating the pharmacophore alignment scores
The alignment score of the best ranked ligand conformer aligned against each ePharmaLib pharmacophore is stored in an individual file. In total, this job generates a collection of 138 output files which should be concatenated in a single file, for a better overview of the predictions.
Hands On: Hands-on 8: Concatenating the scores
Concatenate datasets ( Galaxy version 0.1.1) with the following parameters:
param-file“Datasets to concatenate”: scores (from Hands-on 7)
Rename the output to concatenated_scores.
Click on the galaxy-pencilpencil icon for the dataset to edit its attributes
In the central panel, change the Name field to concatenated_scores
Click the Save button
Ranking the predicted protein targets
The resulting concatenated_scores needs to be re-sorted according to the alignment metric, the Tversky index, i.e. the 10th column. The pharmacophores of the ePharmaLib dataset were labeled according to the following three-component code PDBID-hetID-UniprotEntryName. The contents of the concatenated_scores are as follows:
------    ---------------------------------------------------------------------
column    Content
------    ---------------------------------------------------------------------
     1    Id of the reference structure
     2    Maximum volume of the reference structure
     3    Id of the database structure
     4    Maximum volume of the database structure
     5    Maximum volume overlap of the two structures
     6    Overlap between pharmacophore and exclusion spheres in the reference
     7    Corrected volume overlap between database pharmacophore and reference
     8    Number of pharmacophore points in the processed pharmacophore
     9    TANIMOTO score
    10    TVERSKY_REF score
    11    TVERSKY_DB score
------    ---------------------------------------------------------------------
Rename the output to final_target_prediction_scores.
Click on the galaxy-pencilpencil icon for the dataset to edit its attributes
In the central panel, change the Name field to final_target_prediction_scores
Click the Save button
You can view the contents of the collection final_target_prediction_scores by pressing the eye icon (View data).
The top-ranked protein of our target prediction experiment is 4mvf-STU-CDPK2_PLAFK (Figures 1 & 2) with a Tversky index = 0.73. The general observation that can be made from this ranking of protein hits is the high self-retrieval rate of known targets, which demonstrates the high prediction accuracy of the method. The higher the Tversky index, the higher the likelihood of the predicted protein–ligand interaction; with a value of 0.5 corresponding to a 50% likelihood.
Question
Why was a perfect pharmacophore alignment (Tversky index = 1) not achieved for the top-ranked protein target for which the cocrystallized ligand is staurosporine (STU)?
A perfect pharmacophore alignment because a computational conformer generator (here RDConf in Hands-on 6) is unlikely to be able to reproduce a crystallographic (native) ligand pose with 100% accuracy.
One-step Zauberkugel workflow vs. multi-step workflow
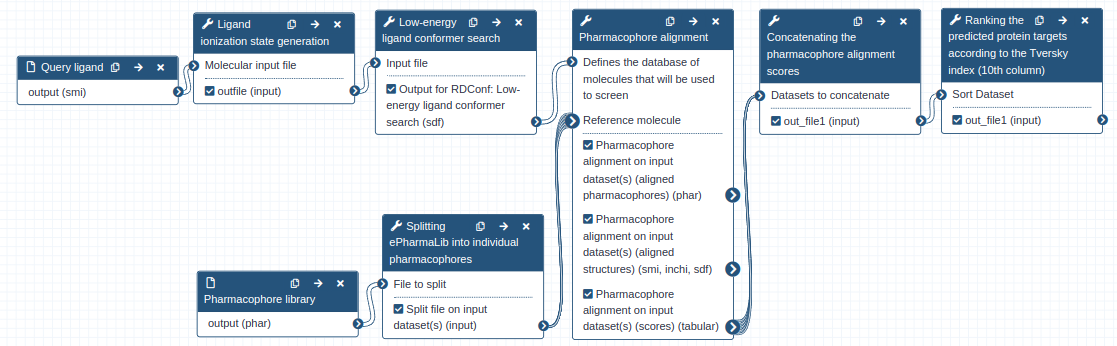
For pharmacophore-based protein target prediction, you can choose to use Galaxy tools separately and in succession as described above, or alternatively use the one-step Zauberkugel workflow as described below (Figure 3).
Hands On: Upload the Zauberkugel workflow
Upload the Zauberkugel workflow from the following URL:
Click on galaxy-workflows-activityWorkflows in the Galaxy activity bar (on the left side of the screen, or in the top menu bar of older Galaxy instances). You will see a list of all your workflows
Click on galaxy-uploadImport at the top-right of the screen
Paste the following URL into the box labelled “Archived Workflow URL”: https://training.galaxyproject.org/training-material/topics/computational-chemistry/tutorials/zauberkugel/workflows/main_workflow.ga
Click the Import workflow button
Below is a short video demonstrating how to import a workflow from GitHub using this procedure:
Video: Importing a workflow from URL
The Zauberkugel workflow requires only two inputs; the ligand structure file (SMI format) and the ePharmaLib dataset (PHAR format). The output of the prediction of human targets of staurosporine performed with the ePharmaLib human target subset (https://zenodo.org/record/6055897) and this workflow is available as a Galaxy history.
Figure 3: Zauberkugel — protein target prediction of a bioactive ligand with Align-it and ePharmaLib
Further analysis
To obtain a docking pose of a protein–ligand interaction predicted from pharmacophore-based protein target prediction, follow the Protein–ligand docking Galaxy training.
Conclusion
You've Finished the Tutorial
Please also consider filling out the Feedback Form as well!
Key points
A pharmacophore is an abstract description of the molecular features of a bioactive ligand.
Pharmacophore-based target prediction is an efficient and cost-effective method.
Frequently Asked Questions
Have questions about this tutorial? Have a look at the available FAQ pages and support channels
Further information, including links to documentation and original publications, regarding the tools, analysis techniques and the interpretation of results described in this tutorial can be found here.
References
Ehrlich, P., 1909 Über den jetzigen Stand der Chemotherapie. Berichte der deutschen chemischen Gesellschaft 42: 17–47. 10.1002/cber.19090420105
Wermuth, C. G., C. R. Ganellin, P. Lindberg, and L. A. Mitscher, 1998 Glossary of terms used in medicinal chemistry (IUPAC Recommendations 1998). Pure and Applied Chemistry 70: 1129–1143. 10.1351/pac199870051129
Steindl, T. M., D. Schuster, C. Laggner, and T. Langer, 2006 Parallel Screening:\hspace0.167em A Novel Concept in Pharmacophore Modeling and Virtual Screening. Journal of Chemical Information and Modeling 46: 2146–2157. 10.1021/ci6002043
Taminau, J., G. Thijs, and H. D. Winter, 2008 Pharao: Pharmacophore alignment and optimization. Journal of Molecular Graphics and Modelling 27: 161–169. 10.1016/j.jmgm.2008.04.003
Nakano, H., and S. Ōmura, 2009 Chemical biology of natural indolocarbazole products: 30 years since the discovery of staurosporine. The Journal of Antibiotics 62: 17–26. 10.1038/ja.2008.4
O’Boyle, N. M., M. Banck, C. A. James, C. Morley, T. Vandermeersch et al., 2011 Open Babel: An open chemical toolbox. Journal of Cheminformatics 3: 10.1186/1758-2946-3-33
Landrum, G., and others, 2013 RDKit: A software suite for cheminformatics, computational chemistry, and predictive modeling.
Desaphy, J., G. Bret, D. Rognan, and E. Kellenberger, 2014 sc-PDB: a 3D-database of ligandable binding sites—10 years on. Nucleic Acids Research 43: D399–D404. 10.1093/nar/gku928
Moumbock, A. F. A., J. Li, P. Mishra, M. Gao, and S. Günther, 2019 Current computational methods for predicting protein interactions of natural products. Computational and Structural Biotechnology Journal 17: 1367–1376. 10.1016/j.csbj.2019.08.008
Moumbock, A. F. A., J. Li, H. T. T. Tran, R. Hinkelmann, E. Lamy et al., 2021 ePharmaLib: A Versatile Library of e-Pharmacophores to Address Small-Molecule (Poly-)Pharmacology. Journal of Chemical Information and Modeling 61: 3659–3666. 10.1021/acs.jcim.1c00135
Did you use this material as an instructor? Feel free to give us feedback on how it went.
Did you use this material as a learner or student? Click the form below to leave feedback.
Hiltemann, Saskia, Rasche, Helena et al., 2023 Galaxy Training: A Powerful Framework for Teaching! PLOS Computational Biology 10.1371/journal.pcbi.1010752
Batut et al., 2018 Community-Driven Data Analysis Training for Biology Cell Systems 10.1016/j.cels.2018.05.012
@misc{computational-chemistry-zauberkugel,
author = "Aurélien F. A. Moumbock and Simon Bray",
	title = "Protein target prediction of a bioactive ligand with Align-it and ePharmaLib (Galaxy Training Materials)",
	year = "",
	month = "",
	day = "",
	url = "\url{https://training.galaxyproject.org/training-material/topics/computational-chemistry/tutorials/zauberkugel/tutorial.html}",
	note = "[Online; accessed TODAY]"
}
@article{Hiltemann_2023,
	doi = {10.1371/journal.pcbi.1010752},
	url = {https://doi.org/10.1371%2Fjournal.pcbi.1010752},
	year = 2023,
	month = {jan},
	publisher = {Public Library of Science ({PLoS})},
	volume = {19},
	number = {1},
	pages = {e1010752},
	author = {Saskia Hiltemann and Helena Rasche and Simon Gladman and Hans-Rudolf Hotz and Delphine Larivi{\`{e}}re and Daniel Blankenberg and Pratik D. Jagtap and Thomas Wollmann and Anthony Bretaudeau and Nadia Gou{\'{e}} and Timothy J. Griffin and Coline Royaux and Yvan Le Bras and Subina Mehta and Anna Syme and Frederik Coppens and Bert Droesbeke and Nicola Soranzo and Wendi Bacon and Fotis Psomopoulos and Crist{\'{o}}bal Gallardo-Alba and John Davis and Melanie Christine Föll and Matthias Fahrner and Maria A. Doyle and Beatriz Serrano-Solano and Anne Claire Fouilloux and Peter van Heusden and Wolfgang Maier and Dave Clements and Florian Heyl and Björn Grüning and B{\'{e}}r{\'{e}}nice Batut and},
	editor = {Francis Ouellette},
	title = {Galaxy Training: A powerful framework for teaching!},
	journal = {PLoS Comput Biol}
}
Congratulations on successfully completing this tutorial!
You can use Ephemeris's shed-tools install command to install the tools used in this tutorial.
Questions:
 Open image in new tab
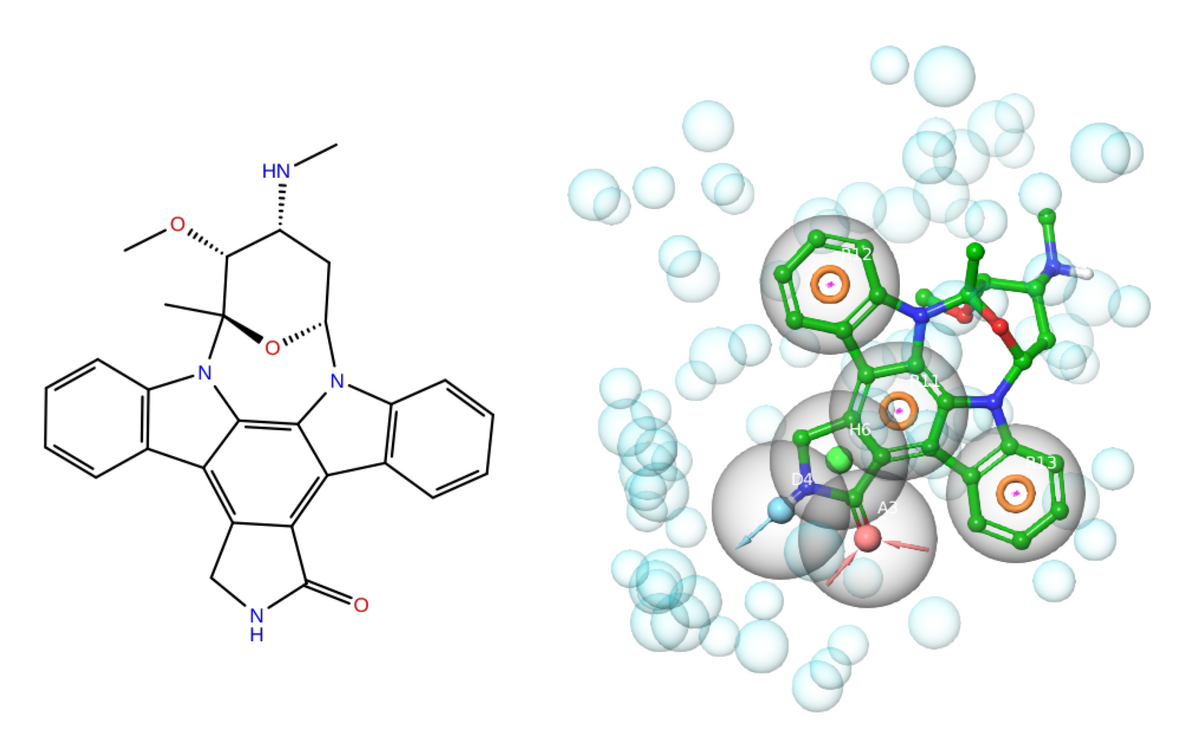 Open image in new tab

 Open image in new tab