Getting Started
Set up a new Galaxy Charts visualization project using the Galaxy Charts UI starter.
The Galaxy Charts UI starter is the quickest path when you want auto-generated forms and Vue helpers. For other stacks, see the Vite-only approach.
1. Set Up Your Repository
- Sign in to your GitHub account.
- Go to the Galaxy Charts Starter repository.
- Click on Use this template and select Create a new repository.
- Name your new repository (e.g.,
MY_VISUALIZATION), then complete the setup by clicking Create repository.
2. Clone Your Repository
Open a terminal window and clone your newly created repository:
git clone https://github.com/USERNAME/MY_VISUALIZATIONReplace USERNAME with your GitHub username and MY_VISUALIZATION with your repository name.
3. Initialize Your Visualization Project
Navigate to your project directory and set up the environment:
cd MY_VISUALIZATION
npm install
npm run dev
4. Next Steps
Open a web browser and navigate to the localhost URL displayed in your terminal (typically in the format http://localhost:PORT):
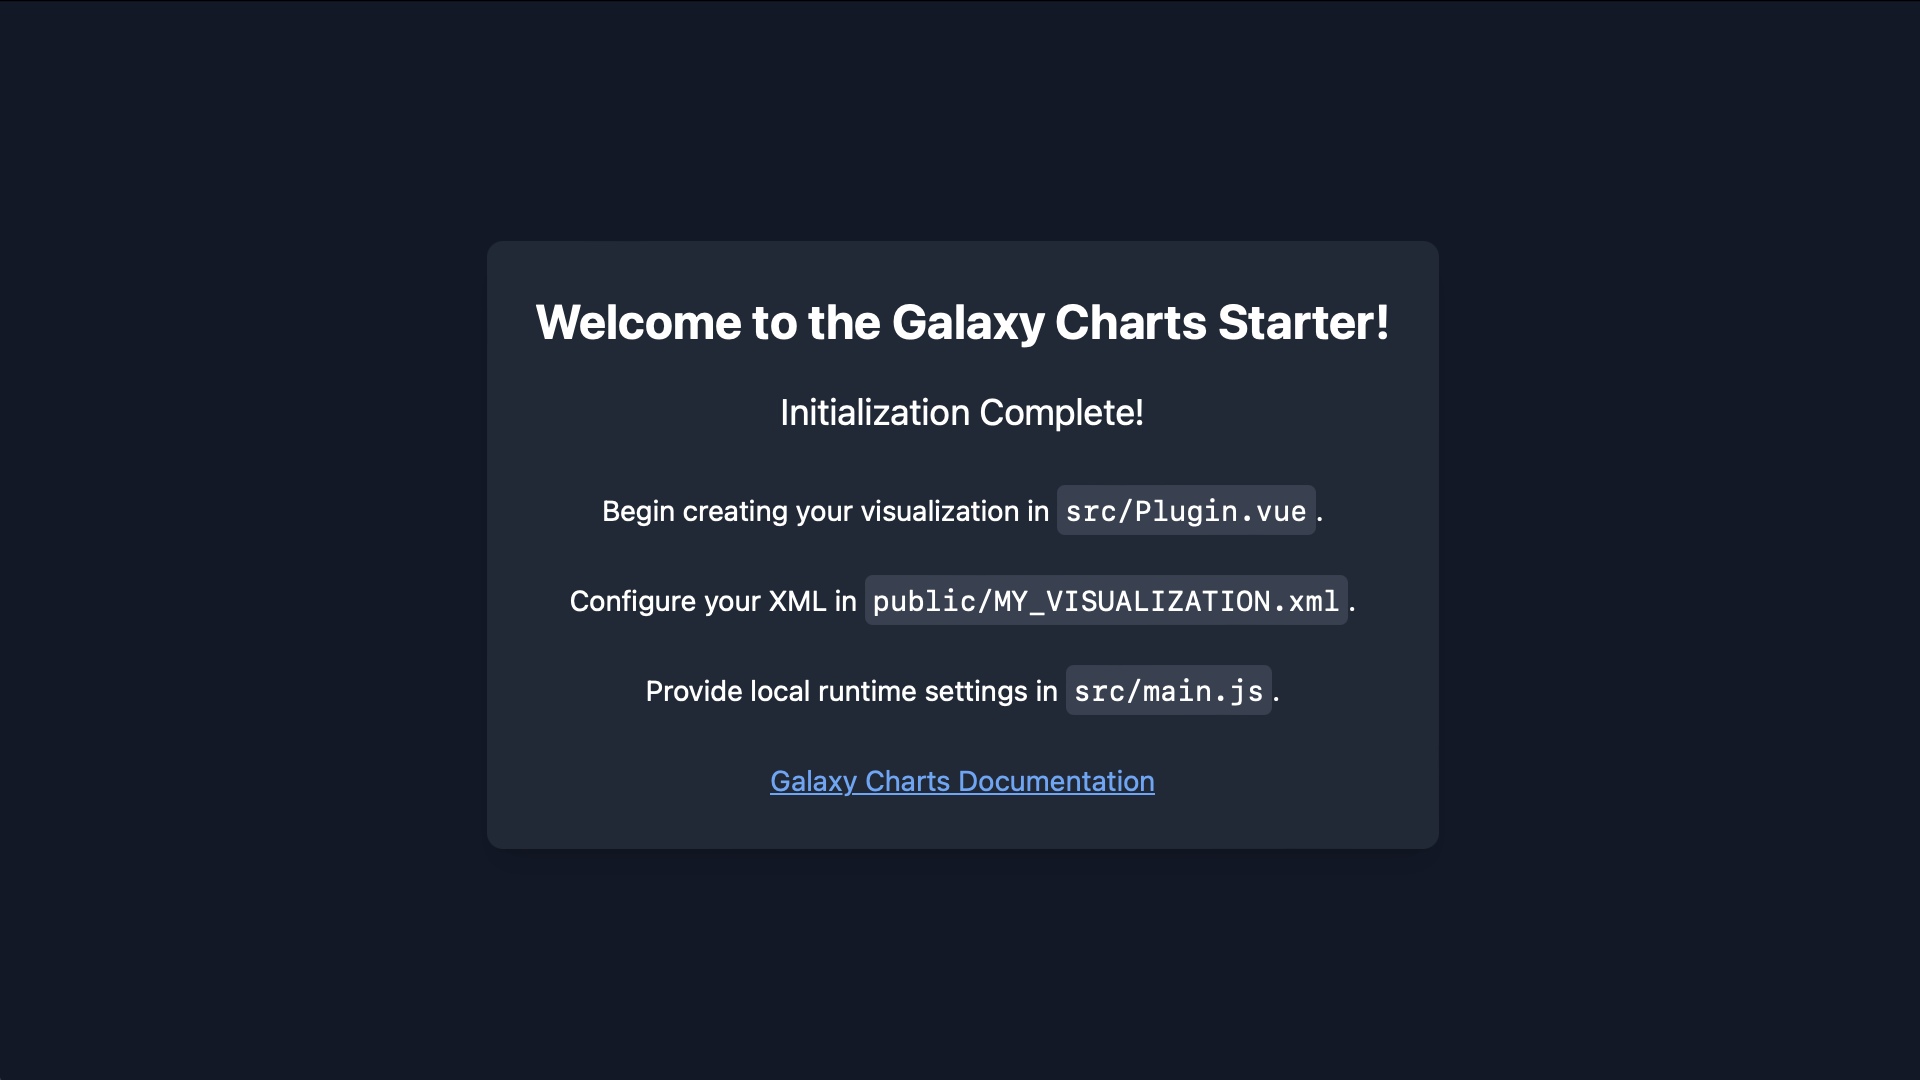
🎉 Congratulations!
Your Galaxy visualization repository is set up and ready for development. Follow the instructions on the splash screen and refer to these docs as you build your custom visualization.
When you’re ready to publish, refer to the Deploy to Galaxy section to share your visualization with the Galaxy community.
Thank you for your contribution!